Learning Log # 26 y= mx+b
Learning Log # 26 y= mx+b. y. Linear Equations Graphing a Linear equation creates a straight line! No curves, no bends! Any linear relationship will have a constant growth factor ! Linear equations are in the form… y = m x + b. Y-intercept. x. Y=??+?. 3. Total Number of tiles. 3.

Learning Log # 26 y= mx+b
E N D
Presentation Transcript
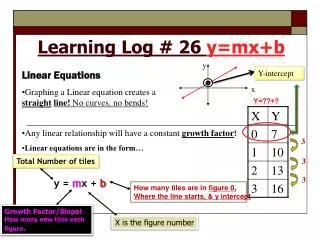
Learning Log # 26 y=mx+b y • Linear Equations • Graphing a Linear equation creates a straightline! No curves, no bends! • Any linear relationship will have a constant growth factor! • Linear equations are in the form… • y = mx + b Y-intercept x Y=??+? 3 Total Number of tiles 3 3 How many tiles are in figure 0,Where the line starts, & y intercept Growth Factor/Slope!How many new tiles each figure. X is the figure number
Learning Log: y=mx+b • *Example of a Linear Equation Figure 0 has 1 tile “b” The Growth Factor is +2 each time “m” So in y=mx + b you get y= 2x + 1