Download
1 / 3
30 likes | 61 Vues
The plastic in oceans originates in both land-based and marine sources. It is estimated that nearly 80% of ocean plastics come from land-based sources and the remaining 20% comes from marine sources. <br><br>Browse our full report with Table of Contents : https://www.bharatbook.com/marketreports/recycled-ocean-plastics-market/1970991

E N D
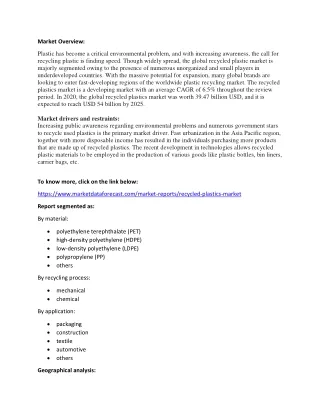
Recycled Ocean Plastics Market Bharat Book Bureau Provides the Trending Market Research Report on “Recycled Ocean Plastics Market”under Plastic Category. The report offers a collection of superior market research, market analysis, competitive intelligence and Market reports. Report Includes: - An overview of the Recycled Ocean Plastics Market - Analyses of the global market trends with data from 2018 to 2019, and projections of compound annual growth rates (CAGRs) through 2024 - Insight into the Top 20 countries ranked by mass of mismanaged plastic and input of plastic to the oceans from most polluting rivers across the World - Information on opportunities and challenges with respect to using plastic waste as a resource with the help of recycled ocean plastics Request a free sample copy of Recycled Ocean Plastics Market Report @ https://www.bharatbook.com/marketreports/sample/reports/1970991 Summary:
Plastic production has increased by about 200 times since 1950. Only 9% of the plastic ever made has been recycled. The remainder is burned or thrown away into nature or landfills. Since plastic is so rigid, it can last for centuries without breaking down. This means that plastics made and thrown away in the past are often found in the earth’s oceans. The plastic in oceans originates in both land-based and marine sources. It is estimated that nearly 80% of ocean plastics come from land-based sources and the remaining 20% comes from marine sources. Plastic marine waste refers to pollution from fishing fleets, which leave behind fishing nets, boats, ropes and sometimes abandoned vessels. Of the 20% from maritime sources, approximately 10% is estimated to come from fishing fleets. This is backed by estimates from the United Nations Environment Program (UNEP) which shows that unused, missing or discarded fishing gear contributes about 10% of total ocean plastic. There are several routes via which plastic enters the ocean ecosystem. Plastic reaches the ocean from coastlines, rivers, tides and aquatic sources. Table of Contents Chapter 1 Recycled Ocean Plastics Market Introduction Plastics in the World's Surface Ocean Opportunities Use Plastic Waste as a Resource Market Forecast of Recycled Ocean Plastics by Resin Type Polyethylene Terephthalate (PET) High-Density Polyethylene Low-Density Polyethylene Polypropylene Polyvinyl Chloride Polystyrene Polyurethane Polycarbonate Other Resins Market for Recycled Ocean Plastics by End Use Consumer Products Building Products Automotive Industrial and Commercial Market for Recycled Ocean Plastics by Region Asia-Pacific Market for Recycled Ocean Plastics European Market for Recycled Ocean Plastics North American Market for Recycled Ocean Plastics RoW Market for Recycled Ocean Plastics Analyst's Credentials Reason for Doing This Study Intended Audience Related BCC Research Reports List of Tables Table 1 : Global Market Volumes of Recycled Ocean Plastics, by Resin Type, Through 2024 Table 2 : Global Market Volumes of Recycled Ocean Plastics, by End User, Through 2024 Table 3 : Top 20 Countries Ranked by Mass of Mismanaged Plastic
Table 4 : Global Market Volumes of Recycled Ocean Plastics, by Region, Through 2024 Table 5 : Asia-Pacific Market Volumes of Recycled Ocean Plastics, by Country, Through 2024 Table 6 : European Market Volumes of Recycled Ocean Plastics, by Country, Through 2024 Table 7 : North American Market Volumes of Recycled Ocean Plastics, by Country, Through 2024 Table 8 : RoW Market Volumes of Recycled Ocean Plastics, by Country/Region, Through 2024 List of Figures Figure 1 : Input of Plastic into Oceans from the Most Polluting Rivers Across the World, 2017 Figure 2 : Plastics Throughout the World’s Surface Oceans, 2017 Figure 3 : Global Market Volumes of Recycled Ocean Plastics, by Resin Type, 2018-2024 Browse our full report with Table of Contents : https://www.bharatbook.com/marketreports/recycled-ocean-plastics-market/197 0991 About Bharat Book Bureau: Bharat Book is Your One-Stop-Shop with an exhaustive coverage of 4,80,000 reports and insights that includes latest Market Study, Market Trends & Analysis, Forecasts Customized Intelligence, Newsletters and Online Databases. Overall a comprehensive coverage of major industries with a further segmentation of 100+ subsectors. Contact us at: Bharat Book Bureau Tel: +91 22 27810772 / 27810773 Email: poonam@bharatbook.com Website: www.bharatbook.com