Astronomical Photometry
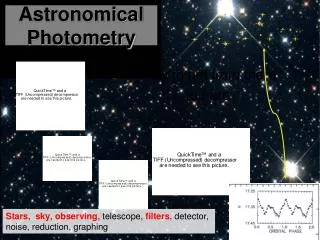
Astronomical Photometry. How to get from there to here. Stars , sky , observing , telescope, filters , detector, noise, reduction, graphing. Apparent magnitude of a star will depend on: Luminosity Distance ( F is flux) Stuff in between it and us (extinction; reddening). Stars.

Astronomical Photometry
E N D
Presentation Transcript
Astronomical Photometry How to get from there to here Stars, sky, observing, telescope, filters, detector, noise, reduction, graphing
Apparent magnitude of a star will depend on: Luminosity Distance (F is flux) Stuff in between it and us (extinction; reddening) Stars Definition of magnitude (visual wavelengths): Definition of “color” of a star:
Getting the effective temperature of a star using UBVRI FILTERS Color of star will also depend slightly on chemical composition (metal-rich vs metal-poor)
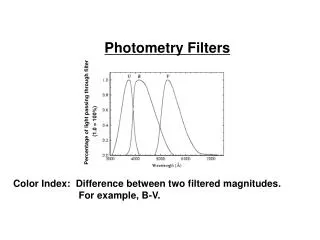
Filters B V R B V R
We always use filters. Original filter set was for a photometer, not CCDs. Telescopes may have different sets of filters (width and peak of band passes may differ, response may differ); may need to TRANSFORM magnitudes to a standard system.
Reddening (“de-bluing”) Antares/Rho Ophiuchus Region
Color Excess Slope of the reddening line for stars earlier than A0: Find star here Extrapolate there For cooler stars, must use spectroscopy.
Sky Bad, badder, baddest!
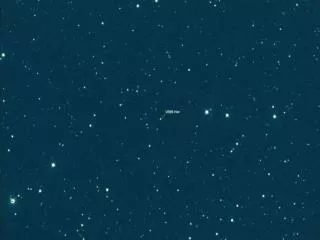
Observations CV’s
FIG. 1.Light curves are presented for the six variable stars. Points represent observed data in B (filled circles), V (asterisks), and I (open circles). The dotted curves represent the best-fitting template to the observed data. The vertical axis in each panel spans 2 mag.