Download
1 / 53
530 likes | 657 Vues
Student Assessment of Teaching as a Component of the Assessment Process: The Teacher Evaluation Assessment Survey (TEAS). Terri Manning, Bobbie Fields and Denise Wells, Central Piedmont Community College. Presentation made to SCAIR, CCPRO, NCAIR Feb 17 th , 2004 – Sunset Beach, NC.

E N D
Student Assessment of Teaching as a Component of the Assessment Process: The Teacher Evaluation Assessment Survey (TEAS) Terri Manning, Bobbie Fields and Denise Wells, Central Piedmont Community College Presentation made to SCAIR, CCPRO, NCAIR Feb 17th, 2004 – Sunset Beach, NC
Why we evaluate teaching? • We do teaching evaluation for two reasons (heavy emphasis on the 1st): • 1. So faculty will have feedback from students that can be used to improve teaching. • 2 . So chairs/division directors can have one consistent indicator of students’ perceptions about faculty (especially part-timers). These are often used as one of several means of teaching assessments for merit.
Problems in General with “Evaluation of Teaching” Tools • Most are created internally • Committees don’t always start at the beginning – “what is good teaching?” • Most are not tested for (at least) validity and reliability • Many are thrown together rather quickly by a committee whose goal is a usable survey tool
Very Few Tools are For Sale • Institutions are unique and what they want to measure is unique (undergraduate, graduate, continuing ed, literacy and distance ed courses) • Because most institutions see them for what they are…. happiness coefficients • No one will stand behind them… “our tool is a valid measure of teaching” • They would never stand up in court • So be very careful! Never site your teaching eval as a reason for not renewing a contract.
Problems with the use of them….. • The scores are used inappropriately and sometimes unethically (or at least stupidly) • They are used for merit pay, promotion and tenure • Scores are treated like gospel - “you are a bad teacher because you scored below the department mean on the tool”
Problems with use, cont. • Critical at the community college where 100% of the job description is “to teach” • Used to make hiring and firing decisions • Teachers are placed in a “catch-22” situation (do I pretend this tool measures teaching or blow it off….. you could be in trouble either way) • Who is included in group means for comparison purposes
A Misconception • You get a bunch of people together • Throw a bunch of questions together • Call it a teaching evaluation tool • And “hocus pocus” it is a valid, reliable, sensitive and objective tool • You can make merit, promotion and tenure decisions with it… no problem
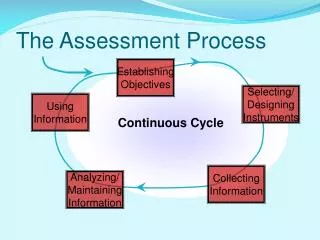
What Makes a Good Questionnaire? • Validity – it truly (with proof) tests what it says it tests (good teaching) • Reliability – it tests it consistently over time or over terms, across campuses and methods • Sensitivity(this is critical) – it picks up fine or small changes in scores – when improvements are made, they show up (difficult with a 5-point likert scale) • Objectivity – participants can remain objective while completing the tool – it doesn’t introduce bias or cause reactions in subjects
Problems Inherent in Teaching Evaluation with Validity • What is “good teaching” • It isn’t the same for all teachers • It isn’t the same for all students • We know it when it is not there or “absent” • Yet, we don’t always know it when we see it (if the style is different than ours) • Who gets to define good teaching • How do you measure good teaching • How can you show someone how to improve it based on a “likert-scale” tool (this is how you raise your mean by .213 points)
Problems Inherent in Teaching Evaluation with Reliability • Students perceptions change (e.g. giving them the survey just after a tough exam versus giving it to them after a fun group activity in class) • From class to class of the same course, things are not consistent • Too much is reliant on the student’s feeling that day (did they get enough sleep, eat breakfast, break up with a boy friend, feel depressed, etc.) • Faculty are forced into a standard bell curve on scores • There is often too much noise (other interactive factors, e.g. student issues, classroom issues, time of day)
Greatest Problem …. Sensitivity • Likert scales of 1-5 leave little room for improvement • Is a faculty member with a mean of 4.66 really a worse teacher than a faculty member with a mean of 4.73 on a given item • Can you document for me exactly how one can improve their scores • In many institutions, faculty have learned how to abuse these in their merit formulas • Faculty with an average mean across items of 4.88 still don’t get into the highest rung of merit pay
IQ – An Example of a (somewhat) Normally Distributed Item (key is range) Standard Deviation = 15
The Reality of Our Tool - Questions #1 of 17,734 responses from Fall 2000) Mean Item Mean = 4.54, Standard Deviation = .77 1. The instructor communicates course objectives, expectations, attendance policies and assignments.
What Would the Scores Look Like? Maximum Score = 5 Standard Deviations Above and Below the Mean
How We Developed the Student Opinion Survey at CPCC • We started with the old tool • An analysis was done (it was rather poor and proof of administrative reactions to current issues) • The old tool contained 20 questions mostly about the business of teaching (handing back exams, speaking clearly, beginning class on time, etc.) • 91% of faculty received all 4s and 5s on each item • The less sophisticated students were, the higher they rated their teachers
Next….. • A subcommittee of the Institutional Effectiveness Committee was formed consisting mainly of faculty • The committee spent one year studying the tools of other colleges and universities and lifting what we liked • We found virtually nothing for sale • What we did find were test banks of questions
Next, cont. • We started with 50-60 questions we liked off of other tools • We narrowed the questions down • We worked through every single word in each statement to make sure they were worded exactly like we wanted them and that they measured what we wanted • We ended up with 36 questions on the new tool
Next, cont. • We worked on the answer scale • We found students had trouble processing the likert scale (it wasn’t defined) • Students liked the A-F grading scale but faculty didn’t (it took far less time) • We worked through the “excellent, good, fair, poor” type of scale and the “strongly agree to strongly disagree” scale. We tested two types during our pilot process.
Next, cont. • We wanted to create subscales with a wider range of scores than a 1-5 scale: • The art of teaching • The science of teaching • The business of teaching • The course • The student
Next, cont. • We pilot tested the tool with about 10 classes and followed it up with focus groups (Fall 1999) • We revised the tool • We pilot tested again (many sections, about 400 students) with two scales (Summer 2000): • A-F scale like grades • A-E scale with definitions for each score
What We Found Students rated faculty differently depending on the scale. Example: 13. How would you rate 13. The instructor the instructor on encourages encouraging thinking and learning thinking and learning. A-F Scale Strongly Agree Scale Mean 3.56 Mean 3.48 St.Dev. .74 St.Dev. .71 A 241 (68.7%) SA 203 (58.8%) B 75 (21.4%) A 107 (31.0%) C 28 (8.0%) PA 31 (9.0%) D 6 (1.7%) D 4 (1.2%) F 1 (.3%) SD 0
More Testing • We took the first full data-set (Fall 2000) and did some comprehensive analysis on the tool. We found: • Students rated the faculty in more difficult classes higher (we and the Deans thought the opposite would be true) • Students rated most course difficulty levels as “about right.” • Students didn’t inflate their course involvement and preparation
We Attempted to Establish Validity • We took the survey results to a Division Director and had them look at the scores from the survey and compare them with what they knew to be true of their faculty over the years. • The faculty analyzed had been at the college for years and had a definite “history of teaching” • Some we looked at scored rather low and some extremely high (but lots of variance) • The Division Director felt the survey picked the faculty out in order of their teaching ability. Those scoring lower were not considered as good a teacher as those who scored high.
Why Validity is Hard • Typically to establish validity, one uses a tool considered “valid” and compares the new tool to the results of the valid tool • With teaching evaluation, there are no established “valid” tools • The only way we knew to validate it was against the historical records of teaching at the College and through some statistical tests (factor analysis)
Results • We finalized the tool in summer of 2000 • We began using it in every class in Fall 2000
Improving Teaching • Chairs or Division Directors should use it appropriately • It is one indicator of teaching (we say it counts no more than 40%) • A criteria or benchmark was set (average of 4 on all items – our criteria) • If a faculty scores an average of 4 out of five on every item, how much more can we really expect? • Do not norm-reference it (set means and standard deviations based on your department’s norms) • Why?????
Case Scenario • In Fall a faculty member rates a 4.22 on item 12 on the survey. In her department the mean on that item was 4.76, SD=.36. This faculty member is told “you scored more than one SD below the department mean and need to improve your teaching.” • That faculty member works very hard to improve her teaching. In the Spring term on item 12 she scores a 4.51. She is happy her scores are now up within one SD of the department mean. • However, everyone else in the department also raised their scores and the new department mean is 4.81, SD=.28. Her scores are still more than one SD below the department mean.
Case Scenario, cont. • What’s worse, she has a friend in another department where the department mean on item 12 was 3.99, SD=.21. • If only she worked in that department, she would score more than one standard deviation above the mean and be considered a good teacher. • That chair wouldn’t ask her to make improvements in her teaching. • Is she really a better or worse teacher in either department????
Case Scenario, cont. • Things can be very different within departments: • Some classes are electives • Some classes are required for majors • Multiple disciplines will be incorporated into a department mean • Some courses are easier than others • Students are forced into some classes and don’t want to be there
We found that we had to impress upon the faculty and staff that: • Once a Tool is Established…. • Every time you change a single word, you invalidate the survey • Every time you change the scale, you invalidate the survey • Every time you add or throw out a question, you invalidate the survey • If not, they want to keep changing it
Comparing the Scales Old Tool % 4-5 = 91% New Tool % 4-5 = 85%
Methodology Factor Analysis • A factor analysis is completed which assumes inter-correlations among the different factors. • We expect that questions will load highly on more than one factor. We utilize an oblique rotation method- Promax with Kaiser Normalization. • This makes theoretical sense. If a faculty member does not utilize multiple methods in teaching or hand papers back in a reasonable amount of time – chances are students won’t rate them as good teachers • How faculty utilize appropriate method and manage the classroom impact how students see them as teachers
Psychometric Properties - Validity Factor Analysis of the Teacher Evaluation Assessment Survey Eigenvalues and Factor Loadings Factor 1Factor 2Factor 3Factor 4 Art Science Business Student Eigenvalue = Eigenvalue = Eigenvalue= Eigenvalue= 17.04 2.04 1.06 1.23
Psychometric Properties - Reliability • Internally consistent = a measure of how consistent the instrument assesses teaching quality across the items • Cronbach’s Alpha - compares the functioning of each item to all the other items within the instrument (a perfectly reliable instrument will produce a coefficient of 1.00) • The TEAS yielded an Alpha of .974 indicating very good internal reliability
Psychometric Properties - Reliability • Externally consistent = a measure of how consistent the instrument assesses teaching quality over terms • Kaiser-Meyer Olkin (KMO) Measure of Sampling Adequacy- Tells us how well our factor analysis did • The TEAS yielded a KMO of .981 in the Fall 2000 dataset and .979 in the Fall 2002 dataset indicating reliability of the instrument.
Psychometric Properties - Sensitivity • While the TEAS may be able to distinguish improvement in instructors who performed “Below Average” or “Very Poor,” it will not identify improvement in those who have already scored in the top rating (this is fine with us) • Another indication that the instrument may not detect small changes is the rather small item standard deviations (.72 - .98) • The greater the spread across items, the better the sensitivity (the subscales produce this)
The Art of Teaching • The Art of Teaching (items:)1-27, 31,32,35,36 • The art of teaching involves the more innate aspects of teaching that are not considered method. Examples of this would be a teacher’s ability to motivate students, be enthusiastic, positive attitude toward students and course, encourage participation, make students feel valued and comfortable asking questions, etc.
Art of Teaching Scale of possible points for this item is 30-150 Points (it is more sensitive). Mean: 131.2 St. Dev: 19.38 Number scoring 30-59 (<2 on every item) 56 ( .3%) Number scoring 60-89 (<3 on every item) 592 ( 3.5%) Number scoring 90-119 (<4 on every item) 3,139(18.4%) Number scoring 120-150 (4/5s every item) 12,527(73.5%) From Fall 2002 dataset
Science of Teaching • The Science of Teaching (items:1-28,31,32,33,35,36) • The science of teaching involves methods or areas that can be taught such as organizing class time, clarifying materials with examples, making relevant assignments, use of text book and teaching new things to students.
Science of Teaching Scale of possible points for this item is 33-165 points. Mean: 144.47 St. Dev: 20.42 Number scoring 33-65 (<2 on every item) 33 ( .2%) Number scoring 66-98 (<3 on every item) 497 ( 2.9%) Number scoring 99-131(<4 on every item) 3,097 (18.2%) Number scoring132-165 (4/5s on every item) 12,286 (72.1%) From Fall 2002 dataset.
The Business of Teaching • The Business of Teaching (items: 1-20, 22,23,25,26) • The business of teaching involves items and issues required by the institution such as handing out syllabi, applying policies and being fair to students, meeting the class for the entire period, holding office hours, providing feedback and announcing tests in advance, etc.
The Business of Teaching Scale of possible points for this item 24-120 points. Mean: 105.7 St. Dev: 15.9 Number scoring 24-47 (<2 on every item) 76 ( .4%) Number scoring 48-71 (<3 on every item) 602 ( 3.5%) Number scoring 72-95 (<4 on every item) 2,967(17.4%) Number scoring 96-120 (4/5s on every item) 12,986 (76.2%) From Fall 2002 dataset
The Student • The Student • (items: 23, 25, 28,31,32,33, 34, 35, 36) • This allows a student to assess the amount of effort they put into the course. While faculty are not responsible for this, it may help explain the variance in teacher evaluation.
The Student Scale of possible points for this item is 9-45 points. Mean: 38.99 St. Dev: 5.15 Number scoring 9-17 (<2 on every item) 20 ( .1%) Number scoring18-26 (<3 on every item) 243 ( 1.4%) Number scoring 27-35 (<4 on every item) 3,432 (20.1%) Number scoring 36-45 (4/5s on every item) 12,387 (72.7%) From Fall 2002 dataset
Regression – One Course for One Instructor In this English 231 class (Amer. Lit.), 89% of the variance in the Art of Teaching can be accounted for by how the students rated the Science and Business of Teaching and how the student rated their classroom participation and readiness.
What Was Envisioned byThe Committee • Faculty determined to be excellent in the art of teaching, the science of teaching and the business of teaching would be selected to put together training modules or mentoring programs in each area through the CTL • Faculty scoring low on any of the subscales would be sent to the CTL for serious help • Changes would be documented over time of improvements made