Download
1 / 10
100 likes | 212 Vues
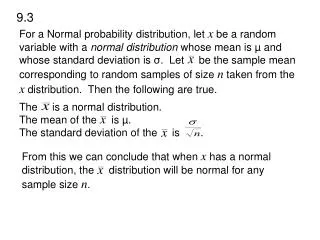
9.3. For a Normal probability distribution, let x be a random variable with a normal distribution whose mean is µ and whose standard deviation is σ . Let be the sample mean corresponding to random samples of size n taken from the x distribution. Then the following are true.

E N D
9.3 For a Normal probability distribution, let x be a random variable with a normal distribution whose mean is µ and whose standard deviation is σ. Let be the sample mean corresponding to random samples of size n taken from the x distribution. Then the following are true. The is a normal distribution. The mean of the is µ. The standard deviation of the is . From this we can conclude that when xhas a normal distribution, the distribution will be normal for any sample size n.
Example – not from your book Suppose a team of biologists has been studying the Pinedale children’s fishing pond. Let x represent the length of a single trout taken at random from the pond. This group of biologists has determined that x has a normal distribution with mean μ = 10.2 inches and a standard deviation σ = 1.4 inches. A. What is the probability that a single trout taken at random from the pond is between 8 and 12 inches long?
Solution Therefore, the probability is about 84.33% that a single trout taken at random is between 8 and 12 inches long.
B. What is the probability that the mean length of five trout taken at random is between 8 and 12 inches? Solution: If we let μ represent the mean of the distribution then, μ = μ= 10.2. If σ represents the standard deviation of the distribution, then,
To create a standard zvariable: Now, standardize the interval = -3.49 < z < 2.86 P(8 < < 12) = P(-3.49 < z < 2.86) = 0.9979 – 0.0002 = 0.9977 The probability is about .9977 that the mean length based on a sample size of 5 is between 8 and 12 inches.
Central Limit Theorem – If xpossesses any distribution with mean µ and standard deviation σ, then the sample mean based on a random sample of size n will have a distribution that approaches the distribution of a normal random variable with mean µ and standard deviation as n increases without limit.
x can have any distribution whatsoever, but as the sample size gets larger and larger, the distribution of will approach a normal distribution. The degree to which the distribution of values fits a normal distribution depends on both the selected value of n and the original distribution of x values. Statisticians agree that if n is 30 or larger the distribution will appear to be normal. But do not apply this rule blindly. In almost all practical applications, a sample size of 30 or more is adequate for the central limit theorem to hold. However in a few rare applications, you may need a sample size larger than 30 to get reasonable results. If the x distribution is definitely not symmetrical about its mean, then the distribution also will display a lack of symmetry. In such a case, a sample size larger than 30 may be necessary to get a reasonable approximation to the normal.
Suppose x has a normal distribution with a mean of µ = 18 and a standard deviation σ = 3. If you draw random samples of size 5 from the x distribution and represents the sample mean, what can you say about the distribution? How could you standardize the distribution? Since the x distribution is given to be normal, the distribution also will be normal even though the sample size is much less that 30. The mean is µ = µ = 18. The standard deviation is We could standardize as follows
Suppose you know that the xdistribution has mean µ = 75 and standard deviation σ = 12, but you have no information as to whether or not the xdistribution is normal. If you draw samples of size 30 from the x distribution and represents the sample mean, what can you say about the distribution? How could you standardize the distribution? Since the sample size is large enough, the distribution will be an approximately normal distribution. The mean of the distribution is µ = µ = 75. The standard deviation of is We could standardize as
Suppose you did not know that x had a normal distribution. Would you be justified in saying that the distribution is approximately normal if the sample size were n = 8? No, the sample size should be 30 or larger if we don’t know that x has a normal distribution.