Download
1 / 6
70 likes | 150 Vues
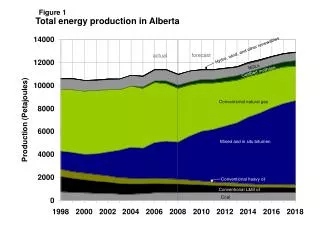
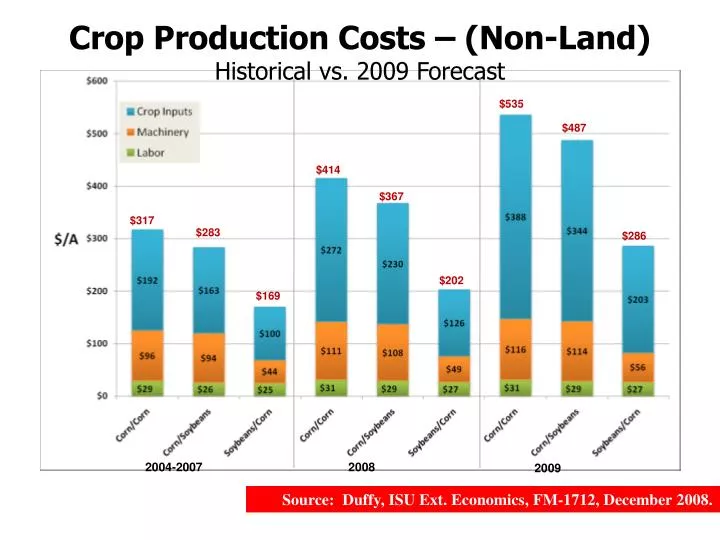
Crop Production Costs – (Non-Land) Historical vs. 2009 Forecast. $535. $487. $414. $367. $317. $283. $286. $202. $169. 2004-2007. 2008. 2009. Source: Duffy, ISU Ext. Economics, FM-1712, December 2008. Total Production Costs (w/Land @ $205/A) 2009 Forecasts.

E N D
Crop Production Costs – (Non-Land)Historical vs. 2009 Forecast $535 $487 $414 $367 $317 $283 $286 $202 $169 2004-2007 2008 2009 Source: Duffy, ISU Ext. Economics, FM-1712, December 2008.
Total Production Costs (w/Land @ $205/A)2009 Forecasts Source: Duffy, ISU Ext. Economics, FM-1712, December 2008.
Corn Following Corn – 2009 Forecasts Low Yield Medium Yield High Yield $805 $740 $675 Average Yield $5.40/bu $5.10/bu $4.88/bu Cost per bushel Source: Duffy, ISU Ext. Economics, FM-1712, December 2008.
Corn Following Soybeans – 2009 Forecasts Low Yield Medium Yield High Yield $757 $692 $627 Average Yield $4.48/bu $4.32/bu $4.21/bu Cost per bushel Source: Duffy, ISU Ext. Economics, FM-1712, December 2008.
Soybeans Following Corn – 2009 Forecasts Low Yield Medium Yield High Yield $530 $491 $452 Average Yield $10.04/bu $9.81/bu $9.64/bu Cost per bushel Source: Duffy, ISU Ext. Economics, FM-1712, December 2008.
Break Even Costs by Crop Rotation and Yield Source: Duffy, ISU Ext. Economics, FM-1712, December 2008.