Download

1 / 24
240 likes | 306 Vues
Learn about two methods- curve fitting and peak tracking, to measure sound wave frequencies using sound pressure data collected with a LabQuest Mini and a microphone.

E N D
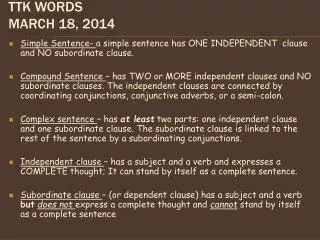
March 18, 2014 waves
Two-source interference pattern with sources oscillating in phase
Looking ahead, standing waves in pipes… On Wednesday and Thursday you’ll be doing assignments involving standing waves in pipes. For those assignments, the data is provided. However, you’ll do a third assignment for next Tuesday’s WebEx for which you collect your own data. (This 3rd assignment isn’t posted yet.) You’ll practice collecting sound data next.
Recall L145 where you used Logger Pro and a motion detector to record position as a function of time for a vertically-oscillating spring. The vertical axis is position, and the horizontal axis is time.
When using a microphone as a probe and detecting sound waves, LP records Sound Pressure as a function of Time.
Try this now… • Connect the LabQuest Mini to your computer. Connect the microphone to CH1. • Open Logger Pro. The microphone should be detected automatically. • Go to Experiment, Data Collection. The Duration should be set to 0.03 s and the Sampling Rate to 10000 samples/second. • Go to this link: http://onlinetonegenerator.com.
Enter 1024 for the frequency. Click Play to generate the 1024 Hz tone. Turn up the volume. I know the sound is annoying, but this won’t last long. • Hold the microphone to your computer speaker. Click the Go button in LP. A waveform should be recorded. • Stop the tone. If your graph didn’t autoscale vertically, click the A icon at the top. • Next you’ll measure the frequency of the sound in two ways.
Method 1: • Do a curve fit to the function: Pres = Asin(Bt + C) + D. • Which coefficient can be used to determine the frequency?
Determining the frequency Method 2 • Read the times of two widely-separated peaks. • Find the difference of the times. • Divide by the number of cycles. This gives the period. • Invert to get the frequency.
In Method 2, when you place the cursor at a peak in LP, you can read the coordinates in the lower left-hand corner below the origin. • The time coordinates show above were read for the two peaks furthest apart. • The frequency is 1/[(0.009248 s – 0.0004454 s)/9] = 1022 Hz
Measuring the fundamental of a toy flute • Use the flute that has no holes along the side. • Hold the flute near the microphone and blow gently to produce a steady tone. • Click Go on LP to record a waveform. • Measure the frequency using Method 1. • Report your result in a private chat message.
Looking ahead, L16… • L16, which is due Monday, requires sustained oscillation of a long, helical spring in standing wave patterns. Some students find it challenging to produce the standing waves. I recommend practicing this well in advance of the due date. You need a clear distance of 5 – 10 m for stretching out the spring. One end of the spring must be fixed in place. This can be done with a sturdy clamp or with a helper who holds the spring. The helper can be another student from this class, but each student must take their turn producing the standing waves and must collect their own data. Each student must also carry out the analysis and write the report independently. If you have a helper, cite them as a lab partner. • You’ll record data in an online form. There’s a preliminary set of measurements that must be done before you collect the data that you’ll use for the analysis. Therefore, give yourself plenty of time to a) practice oscillating the spring, b) collect preliminary data, c) collect final data, d) do the LP analysis, e) answer the questions.
Cause and effect in using v = fl • Consider the equation v = sqrt(FT/m). When we write an equation in this form, the quantity represented by the symbol on the left, v in this case, is typically taken to be a function of the quantities on the right. Thought of another way, the tension and linear density of the string are causes and the speed of the wave is the effect. • This convention does not apply to v = fl. Frequency and wavelength are not causes of wave speed. The fact that textbooks typically write v = flleads many students to incorrectly conclude that wave speed depends on frequency and wavelength. In order to be consistent with the convention that the dependent variable is on the left of the equal sign, we should write: • = v/f or f = v/l. • The wave speed typically serves as a constant of proportionality. It depends on the properties of the medium, which do not change significantly in many situations.
Drawing of standing wave patterns • When you draw a standing wave pattern, do the following: • Draw 2 curves, one for each extreme of the motion. • Draw the equilibrium position. This will make it clear where the nodes and antinodes are. equilibrium line
While we’re on the subject... ...what systems that you’re aware of have antinodes at one or both ends of the standing wave?
Download link for the clip http://courses.ncssm.edu/apbres/clips/spring_hs.mov
V20. Standing Waves on a String • Prelab questions: • Describe a method to accurately determine the linear density of the string. The most direct method is to use a mass balance to measure the mass and then divide by the length of the string. To improve accuracy, the longest length available (within reason) should be used. • How can you calculate the tension in the string? What assumption(s) is(are) involved? If there is no friction of the string with the pulley, then the tension is equal to the hanging weight. Multiply the mass of the hanging weight by 9.8 m/s2. • Given the weight hanging from the string and the linear density, how can you calculate the wave speed in the string? Use v = (FT/μ0.5).
V20, con’t. • Draw the standing wave pattern of the fundamental. • If the length of the string is L, what is the wavelength of the fundamental? l1 = • What frequency do we need to set for the oscillator to generate the fundamental (in terms of v and L)? f1 = equil line
V20, con’t. • What if we wanted to generate the 2nd harmonic? What frequency would be needed? f2 = • Will this change in the frequency change the wave speed? Explain. • How could we change the wave speed to make it, say, 25% greater than its present value?
V20, con’t. • If we changed the wave speed, how would the wavelength have to change to produce 2 antinodes? • For the greater wave speed, how would the frequency have to change to produce 2 antinodes?. • Suppose one did an experiment to measure fn vs. n for n = 1 to 4 with the string under constant tension. If one then did a linear fit to a plot of fn vs. n, how would one use the slope of the fit to determine the wave speed? answer left for L16 analysis
V20AL Complete this assignment after today’s session is closed. • Determine a formula in terms of things measured in the video for the unknown amount of mass ma that the instructor added to the string near the end of the video. (This is the mass added to the original mass, m, that was already present.) The symbols that you may have in your final equation are m, f1, f2, f3, and f4 for the four measurements of frequency. You will not need all of the symbols. Linear density will not be needed, as it will divide out. • After determining the formula, calculate the value of ma.