CS 277, Data Mining Review of Predictive Modeling
780 likes | 968 Vues
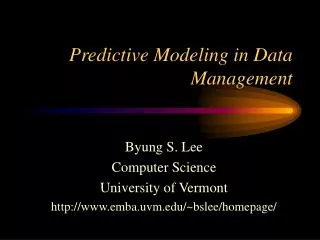
CS 277, Data Mining Review of Predictive Modeling. Padhraic Smyth Department of Computer Science Bren School of Information and Computer Sciences University of California, Irvine. Outline. Overview of predictive modeling: Model Loss function Optimization

CS 277, Data Mining Review of Predictive Modeling
E N D
Presentation Transcript
CS 277, Data MiningReview of Predictive Modeling Padhraic Smyth Department of Computer Science Bren School of Information and Computer Sciences University of California, Irvine
Outline Overview of predictive modeling: Model Loss function Optimization Look at binary classification with Logistic as a specific example - loss functions - feature selection - training algorithms (cover SGD) Evaluation techniques (in detail) - cross validation as a general principle - different metrics:
Case Study: Churn Example from Fawcett and Provost • Use slides from Tom
Add Slides on Practical Issues • Feature selection • Learning curves • Missing data • Etc, etc
Typical Predictive Modeling Tasks • Classification: predicting a categorical outcome • Spam email • Automatically classifying the sentiment of a product review • Regression: • Predicting the lifetime value of a customer • Ranking, e.g., by P(y | x) • Ranking which Web advertisement a user is likely to click on • Credit scoring
Data as a Matrix….. Rows -> objects/individualsColumns -> measurements/variables ID Income Age …. Monthly Debt Good Risk? 18276 65,000 55 …. 2200 Yes 72514 28,000 19 …. 1500 No 28163 120,000 62 …. 1800 Yes 17265 90,000 35 …. 4500 No … … … …. … … … … … …. … … 61524 35,000 22 …. 900 Yes
Notation for Predictive Modeling • Training data, pairs x(i), y(i), i = 1….N • N times d matrix of data • Each row corresponds to a d-dimensional vector x(i), i= 1,….N • Additional column of target values y(i), i= 1,….N (e.g., y real-valued, y binary, etc) • We want to learn a model that can predict the y given x • f(x; a) is our model: some scalar function of x • a is a p-dimensional parameter vector • e.g., f(x; a) = a0 + a1 x1 + a2 x2 + …. adxd (linear predictor, p = d+1) • We can measure the quality of any particular model with an error function • Squared Error score (as an example: we could use other scores)Etrain(a) = Si [y(i)– f(x(i) ; a) ]2 where f(x(i) ; a) is the prediction of y by the model using parameters a
Empirical Learning • Minimize the total error Etrain(a) on the training data e.g., Etrain(a) = Si[y(i)– f(x(i) ; a)]2 • Note that in minimizing we treat Etrain(a) as a scalar function of a p-dimensional unknown parameter vector a, with known fixed x’s and y’s. • Minimizing Etrain(a) as a function of a is an optimization problem • Occasionally there is a direct solution, e.g., via linear algebra • More typically we must use some form of local iterative search • E.g., gradient descent, starting from a random starting point in a space
Generalization to New Data • Will minimizing Etrain(a) give us the best possible predictor? • No: we really want to find the f(x; a) that best predicts y on future data, i.e., in minimizing expected value of [y– f(x ; a)]2 on future data • In practice we can only use Etrain(a) as a surrogate for performance on future data • Empirical learning • Minimize E(q) on the training data Dtrain • If Dtrain is large and model is simple we are assuming that the best f on training data is also the best predictor f on future test data Dtest • Note that the test error Etest(a) on new test data might be significantly larger than Etrain(a) on training data
From Tatem et al., Nature 2004. (see also response letters at http://faculty.washington.edu/kenrice/natureletter.pdf)
f(x|a) E =distance(predictions,targets) e.g, = S (y – f(x|a) )2 Learning: minimizing E as a function of a targets,y predictions inputs,x
2: MODEL f(x|a) 1: DATA 3: OBJECTIVE FUNCTION E =distance(predictions,targets) e.g, = S (y – f(x|a) )2 4: OPTIMIZATION Learning: minimizing E as a function of a targets,y predictions inputs,x
Gradient Descent • Regression requires O( d3 ) matrix inversion • If d = 10k, 100k, 1 million, -> very slow! • Alternative • Directly minimize loss function via gradient descent • Algorithm: • Start at some a , e.g., randomly selected • Compute local gradient • Move downhill in space some small distance • If not converged, compute gradient and move again • If E is convex then this is usually works well • e.g., linear models + squared error = convex problem
Optimization Easy (convex) E(a) a
Optimization Easy (convex) E(a) a E(a) Hard (non-convex) a
Stochastic Gradient Descent (SGD) • Standard gradient descent • Per iteration, compute gradient by summing over N gradient terms • Stochastic gradient descent • Compute gradient per case, and update parameters • Cycle through cases in turn or in random order • Usually far fewer iterations than standard method • O(N d) per iteration can be O(N r) for sparse data ( r = average # non-zero elements per row, r << d) • Many variants • “mini-batch”: update based on gradient from small sets of cases • “online”: continuously update model as new cases arrive
SGD Example • Binary Text Classification Problem • d = 47k word features • N = 781k documents • Various forms of linear classifiers with regularization From Leon Bottou, Stochastic Gradient Learning, MLSS Summer School 2011, Purdue University, http://learning.stat.purdue.edu/mlss/_media/mlss/bottou.pdf
A Simple Baseline Model: k-Nearest Neighbor Regression • Given a training data set Dtrain with {x, y} training pairs • To predict y for a new vector x*? • Find the k nearest neighbors to x* in the training data Dtrain • e.g., using Euclidean distance (be careful about scaling!) • Prediction of y is y* = the average y values of the k-nearest neighbors • Comments on k-NN regression • Extremely simple method, can be a useful baseline • The predictions for y are piecewise constant functions of x • An example of a “non-parametric” method • k can be chosen automatically by cross-validation (see later slides) • Same idea can be used for classification (when y is a categorical class variable) • Weaknesses • Performance tends to degrade as d (dimensionality of x) increases • Can be very sensitive to how distance is defined • Requires that all of training data Dtrain be stored in memory and accessed at prediction time
Models, Loss Functions, and Objective Functions • Models: • Linear weighted sums of the input variables (linear regression) • Non-linear functions of linear weighted sums (logistic regression, neural networks, GLMs) • Thresholded functions (decision trees) • Objective functions: • Regression: Squared (L2) error, Absolute (L1) error, Robust loss, log-loss/log-likelihood • Classification: classification error, margin, log-loss/log-likelihood • Optimization methods • For linear models, squared error loss: solving sets of linear equations in p parameters • Tend to scale as O(N d2 + d3) • More complex models • Iterative search methods, e.g., gradient-based, 2nd-order (Newton), etc Important point: most learning algorithms are a combination of Model + Objective Function + Optimization Method
Complexity versus Goodness of Fit Training data y x
Complexity versus Goodness of Fit Here the red circles represent training data and the blue curves are models fitted to the data Too simple? Training data y y x x
Complexity versus Goodness of Fit Here the red circles represent training data and the blue curves are models fitted to the data Too simple? Training data y y x x Too complex ? y x
Complexity versus Goodness of Fit Here the red circles represent training data and the blue curves are models fitted to the data Too simple? Training data y y x x Too complex ? About right ? y y x x
Complexity and Generalization Score Function e.g., squared error Stest(q) Strain(q) Model Complexity (e.g., number of parameters) Optimal model complexity
Complexity and Generalization Score Function e.g., squared error Stest(q) Amount of overfitting Strain(q) Underfitting Model Complexity Overfitting
Bias and Variance in Model Fitting Bias: Expected difference between our model’s predictions and the true targets Can be reduced by making the model more complex High-bias -> model with few parameters, e.g., linear predictor Low-bias -> model with many parameters, e.g., large neural network Variance: Variability in our model’s predictions across data sets of size N Can be reduced by increasing N High-variance -> model with many parameters, e.g., large neural network Low-variance -> model with few parameters, e.g., linear predictor
Bias-Variance Examples High bias Low variance Low bias High variance y y x x Good bias-variance trade-off y Here the red circles represent training data and the blue curves are models fitted to the data x
Classic Result: The Bias-Variance Tradeoff Expected Squared-error on Test Data = Bias2 + Variance There is a fundamental tradeoff between bias and variance (“no free lunch”) Typically when we decrease bias we increase variance, and vice-versa -> strive to find a model that balances both terms
Classic Result: The Bias-Variance Tradeoff Expected Squared-error on Test Data = Bias2 + Variance There is a fundamental tradeoff between bias and variance (“no free lunch”) Typically when we decrease bias we increase variance, and vice-versa -> strive to find a model that balances both terms Question: why don’t we just measure Bias and Variance on the training data and then select the model that minimizes Bias2 + Variance ?
Complexity and Generalization Score Function e.g., squared error Stest(q) Strain(q) High bias Low variance Low bias High variance Optimal model complexity
Holdout (Test) Data performance (as measured by AUC) as a function of the number of nodes in a decision tree classifier, for a “churn” classification problem, N =47,000 From Chapter 8: Visualizing Model Performance, in Data Science for Business (O Reilly, 2013), with permission from the authors, F. Provost and T. Fawcett
True relationship between X and Y is in black Predictions of KNN regression with K=1 is in blue and K=9 in red. Note that both are piecewise constant as a function of x and red (K=9) is smoother N = 100 training data points From Chapter 3 on Linear Regression in An Introduction to Statistical Learning, with Applications in R (Springer, 2013) with permission from the authors: G. James, D. Witten, T. Hastie and R. Tibshirani (text available online)
True relationship between X and Y is in black Predictions of KNN regression with K=1 is in blue and K=9 in red. Note that both are piecewise constant as a function of x and red (K=9) is smoother N = 100 training data points Test mean-squared error (MSE) for the problem on the left X-axis is 1/K where K is the value used for predictions from KNN regression Dotted black line is for linear regression From Chapter 3 on Linear Regression in An Introduction to Statistical Learning, with Applications in R (Springer, 2013) with permission from the authors: G. James, D. Witten, T. Hastie and R. Tibshirani (text available online)
A more non-linear relationship, in black Predictions of KNN regression with K=1 is in blue and K=9 in red. N = 100 training data points From Chapter 3 on Linear Regression in An Introduction to Statistical Learning, with Applications in R (Springer, 2013) with permission from the authors: G. James, D. Witten, T. Hastie and R. Tibshirani (text available online)
A more non-linear relationship, in black Predictions of KNN regression with K=1 is in blue and K=9 in red. N = 100 training data points Test mean-squared error (MSE) for the problem on the left X-axis is 1/K where K is the value used for predictions from KNN regression Dotted black line is for linear regression From Chapter 3 on Linear Regression in An Introduction to Statistical Learning, with Applications in R (Springer, 2013) with permission from the authors: G. James, D. Witten, T. Hastie and R. Tibshirani (text available online)
Panels show how the error increases as the number of variables/parameters in the problem increases Dotted line is MSE for linear regression, green lines are MSE for KNN as a function of 1/K p=1 corresponds to the previous slide with 1 variable. P=2, 3, ..20 are problems with p variables, where All except the first variable are noise (i.e., y only depends on the first variable). Note how kNN’s performance decreases rapidly as p increases, compared to linear regression A clear example of a low-variance model (linear regression) outperforming a high-variance model (KNN) From Chapter 3 on Linear Regression in An Introduction to Statistical Learning, with Applications in R (Springer, 2013) with permission from the authors: G. James, D. Witten, T. Hastie and R. Tibshirani (text available online)
Defining what “best” means • How do we measure “best”? • Best performance on the training data? • K = p will be best (i.e., use all variables), e.g., p=10,000 • So this is not useful in general • Performance on the training data will in general be optimistic • Practical Alternatives: • Measure performance on a single validation set • Measure performance using multiple validation sets • Cross-validation • Add a penalty term to the score function that “corrects” for optimism • E.g., “regularized” regression: SSE + l sum of weights squared
Training Data Use this data to find the best q for each model fk(x ; q) Training Data
Validation Data Use this data to find the best q for each model fk(x ; q) Training Data • Use this data to • calculate an estimate of Sk(q) for each fk(x ; q) and • select k* = arg minkSk(q) Validation Data