Download
1 / 17
170 likes | 180 Vues
This study analyzes the energy balance and greenhouse gas emissions in Kiwi and Citrus farms in the Arta area of Greece. It assesses energy inputs, outputs, and emissions to determine energy efficiency and carbon footprint.

E N D
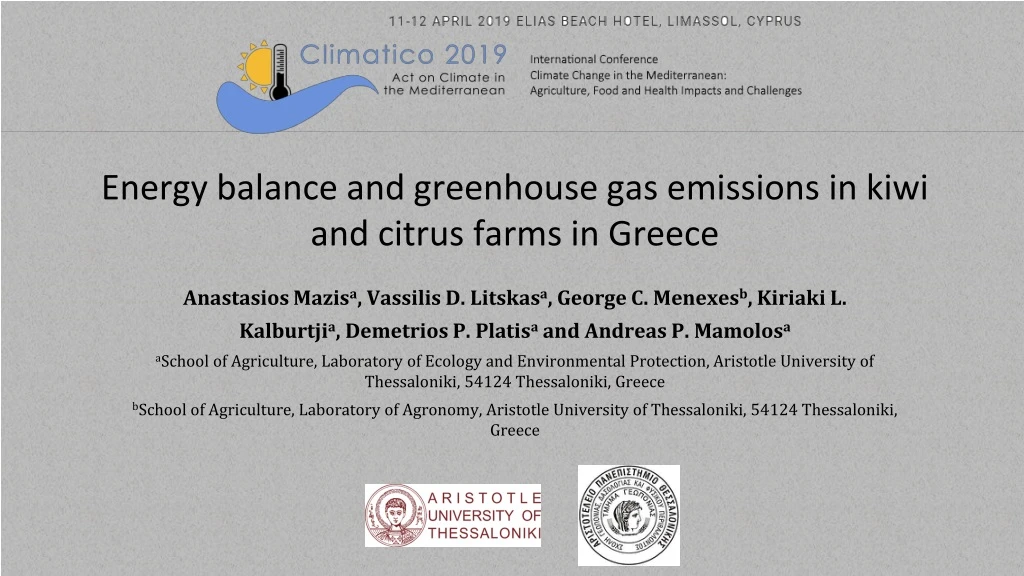
Energy balance and greenhouse gas emissions in kiwi and citrus farms in Greece Anastasios Mazisa, Vassilis D. Litskasa, George C. Menexesb, Kiriaki L. Kalburtjia, Demetrios P. Platisa and Andreas P. Mamolosa aSchool of Agriculture, Laboratory of Ecology and Environmental Protection, Aristotle University of Thessaloniki, 54124 Thessaloniki, Greece bSchool of Agriculture, Laboratory of Agronomy, Aristotle University of Thessaloniki, 54124 Thessaloniki, Greece
Energy consumption in agri-food chain • Globally, the agri-food chain: • consumes 30 % of the world’s available energy • more than 70 % consumed beyond the farm gate (after harvest). • More than 1/3 of the food we produce is lost or wasted, and with it about 38 % of the energy consumed in the agri-food chain. Source: FAO - the role of energy in food security and climate (http://www.fao.org/3/an913e/an913e01.pdf)
Data from the EU • The energy for food production (field to fork): 26 % of the EU’s energy consumption. (JRC, 2015) http://publications.jrc.ec.europa.eu/repository/bitstream/JRC96121/ldna27247enn.pdf
Shares of energy in the production stages is very different in different products: • For meat and dairy the agriculture step is overwhelming, • packaging plays an important role in the ‘bottled’ products (milk, oil, beer and mineral water). • In the field, farming practices determine to a large extent the amount of energy inputs used in crops. Shares of energy embedded in a kilogram of each of the 17 products along the different production steps (JRC, 2015) http://publications.jrc.ec.europa.eu/repository/bitstream/JRC96121/ldna27247enn.pdf
Εισαγωγή: Τρόποι Καλλιέργειας Σκοπός της εργασίας Greenhouse Gas Emissions - Carbon dioxide (CO2) Fossil fuel, deforestation, land clearing for agriculture, and degradation of soils. Most N2O is produced after croplands are fertilized, when soil microbes convert some of the applied nitrogen from fertilizer and manure into N2O. Nitrous oxide (N2O) GHGs Burning biomass to prepare fields Ruminant livestock digest their food through enteric fermentation, which produces methane. Methane (CH4) Rice grown in paddies, where bacteria break down biomass submerged in the fields.
Contribution of Agriculture to Global GHG Emissions Εισαγωγή: Τρόποι Καλλιέργειας Σκοπός της εργασίας Agriculture, which is a significant contributor to global GHG emissions, must do its share to minimize climatechange
Life Cycle Assessment (LCA) • life cycle assessment (LCA) is a tool for analyzing the environmental impacts and resources used throughout a product's life, from raw materials extraction to production, and extending through product use and disposal. • LCA can be used to compare alternative products, processes or services; compare alternative life cycles for a certain product or service; or identify the parts of a life cycle where the greatest improvements can be made (optimization process). The goal:compare the full range of environmental effects assignable to products and services by quantifying all inputs and outputs of material flows, and then assessing how these material flows impact the environment Energy and Greenhouse Gases
Aim of the study • The aim of this study was to determine the energy balance and GHG emissions in Kiwi and Citrus orchards, located in the area of Arta, Greece.
Study area • The farms were located near the city of Arta, Greece • 10 Citrus farms and 16 Kiwi farms
Εισαγωγή: Τρόποι Καλλιέργειας Energy inputs-outputs Human labor, machinery, electricity, diesel fuel, fertilizers, biocides amounts. Converted into energy values using the most recent energy coefficients taken from the literature. Inputs Unit of measurement: MJ ha-1 (or MJ kg-1) Product yield. Converted into energy unit using their corresponding coefficients from the literature or experimentally (Bomb Calorimeter). Outputs
Εισαγωγή: Τρόποι Καλλιέργειας Σκοπός της εργασίας Carbon Footprint Using the IPCC guidelines to convert inputs to emissions. Unit of measurement:CO2eq Amount of produced CO2eq: multiplying the input used rate (diesel fuel, chemical fertilizer, biocide, farmyard manure and electricity) by their corresponding emission coefficient from the literature. Cultivation process Carbon Footprint kg CO2eq Agricultural product Kg Indicator =
Citrus energy balance • Citrus energy inputs : 52217 (s.d. 4902) MJ/ha. • Energy intensity (Inputs/kg product) = 2.32 (s.d. 0.20) MJ/kg • Energy efficiency (outputs/inputs) = 0.83 (s.d. 0.07)
Kiwi energy balance • Kiwi energy inputs : 48774 (s.d. 5010) MJ/ha. • Energy intensity (Inputs/kg product) = 2.39 (s.d. 0.48) MJ/kg • Energy efficiency (outputs/inputs) = 0.83 (s.d. 0.19)
Energy intensity (MJ/kg) • In studies on olive trees, vines and orchards in the Mediterranean, the reported values for EI range from 0.99 for indigenous vine varieties to 59 MJ/kg for intensively managed olive groves (Genitsariotis et al., 2000; Litskas et al., 2011, 2013; Michos et al., 2018). • Kiwi and Citrus 2.39 and 2.32 MJ/ha.
Conclusions • Similar energy inputs, intensity and efficiency in Citrus and Kiwi farms located in Arta, Greece. • The factors determining the energy inputs are: 1) irrigation, 2) fuel, 3) machinery, 4) fertilizers. • GHG emissions are considered low, relevant to values from the literature, but fuel and N2O emissions from soil were only accounted at this point.