Download
1 / 26
270 likes | 427 Vues
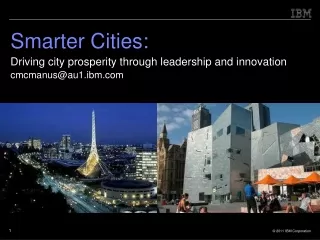
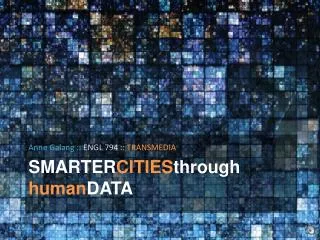
Anne Galang :: ENGL 794 :: TRANSMEDIA. SMARTER CITIES through human DATA. RECAP: Smart Cities and Big Data. Sensor networks address challenges of growing cities: Traffic congestion Space – homes and public space Water and energy use Carbon emissions Tighter city budgets

E N D
Anne Galang ::ENGL 794 :: TRANSMEDIA SMARTERCITIESthroughhumanDATA
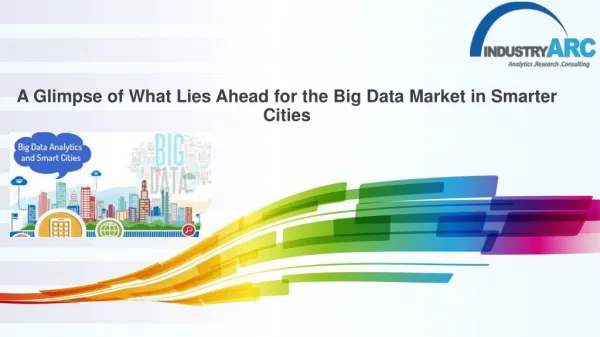
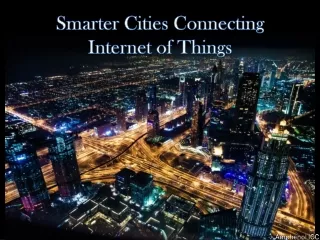
RECAP: Smart Cities and Big Data • Sensor networks address challenges of growing cities: Traffic congestion Space – homes and public space Water and energy use Carbon emissions Tighter city budgets Aging infrastructure • Big Data/Open data We’re collecting a lot of data! Open data – accessibility to public – sparks innovation and allows citizens to have a meaningful interaction with the information that surrounds them
Observations • From efficiency and sustainability recent focus on human-centered solutions • User-friendly interfaces • Increased focus aesthetics, design • Focus on quality of life • Projects tend to be driven by private companies and municipal governments • More recently researchers and artists
Limitations of Top-down projects • Anthony Townsend critiques current applications of context-aware (sensor) systems: • “[These top down visions] fail to describe scenarios in which location-aware technologies will add meaning and understanding to human life” • “Into this breach have stepped artists who are co-opting this new [media] … to raise fundamental questions about the nature of public space and surveillance”
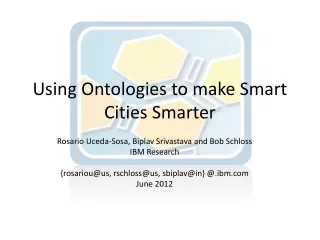
Grassroots systems • Bottom-up context-aware systems • Web based content-tagging systems • Photosharing such as Flikr, Instagram • Tagging places: Open Street Map, FourSquare • Allow users to dynamically create context using open vocabularies
San Francisco Emotion Map From the project web site: “The San Francisco Emotion Map involved a total of 98 participants exploring San Francisco’s Mission District neighborhood using the Bio Mapping device Nold invented. The project invited the public to go for a walk using the device, which records the wearer’s physiological response to their surroundings. The results of these walks are represented on this map using colored dots and participant’s personal annotations. The San Francisco Emotion Map is a collective attempt at creating an emotional portrait of a neighborhood and envisions new tools that allow people to share and interpret their own bio data.”
We Feel Fine • [screen shots]
We Feel Fine • Explores human emotions • Crawls web for blog entries with the term “I feel”/”I am feeling” • Data collected: • Feeling (happy, sad, depressed, etc.) • Age (in ten year increments - 20s, 30s, etc.) • Gender (male or female) • Weather (sunny, cloudy, rainy, or snowy) • Location (country, state, and/or city) • Date (year, month, and/or day) • Updated every 10 minutes
Some thoughts • Emotional Map • Wearable sensors • Data from individual’s reactions to urban surroundings • Small sample size – requires specialized equipment • We Feel Fine • Large sample size • Taps into existing emotional data that individuals are posting online. (Human “Big Data”) • How to apply this model to an urban setting?
Psychogeography “an urban neigborhood is determined not only by geographical factors, but also by the image that its inhabitants… have of it” – Chombar de Lauwe (qtd in Debord’s “Theory of the Derive”)
“The sudden change of ambiance in a street within the space of a few meters; the evident division of a city into zones of distinct psychic atmospheres… these phenomena all seem to be neglected.” – Guy Debord, “Introduction to a Critique of Urban Geography”
Imageability “[The Image of the City ] considers the visual quality of the American city by studying the mental image of that city which is held by its citizens.” “Nothing is experienced by itself, but always in relation to its surroundings, the sequences of events leading up to it, memory of past experiences.” -Kevin Lynch, The Image of the City
Goals of my project • Explore the link between immediate (urban) surroundings and emotion • How neighborhoods within a city differ in “psychic atmosphere”/”imageability” • How an individual interprets those surroundings – one’s image of the neighborhood • Poetics of data • Tapping into grassroots generated data • Human-centered data – to add “meaning and understanding to human life”
Visible Cities (See PDF) I chose the title “Visible Cities” for my project as a play on the “Invisible Cities” theme of our class blog and some of our key course readings. With this project I wanted to make visible some of the otherwise unseen/intangible elements of city neighborhoods.
Visible Cities • Psychogeography • The project explores the relationship between atmosphere (physical surroundings), mental image (how those surroundings are interpreted) and emotion in an attempt to map the psychogeography of neighborhoods.
Visible Cities • NYC and “distinct psychic atmospheres” • I selected NYC, particularly Manhattan, as it is a city of clear-cut neighborhoods, each with a distinct physical atmospheres and each calling to mind different characteristics. The neighborhoods of Manhattan are a striking example of Debord’s “distinct psychic atmospheres” within the same city. • The photo galleries illustrate the“sudden change of ambiance” between neighborhoods within close physical proximity. • Photos are curated from Flickr, Tumblr and Instagram. I selected photos that I thought representative of the hundreds of images from each neighborhood posted through these apps.
Visible Cities • Mental image • Word clouds represent the collective mental image of a neighborhood– i.e., what comes to mind when people think of Harlem, Greenwich Village, etc. • These word clouds were generated by searching Tumblr tags of each neighborhood name (for example, #harlem, #uppereastside), and running these search results, along with the neighborhood’s Wikipedia entry, through a word cloud generator.
Visible cities • Emotion • The feelings map is a mockup of what the emotional map can look like based on geotagged Twitter and blog entries posted from a mobile app. • The feeling words are taken from real Twitter posts that I found searching for key phrases “I feel…”, “I am feeling…”, and “I am…” that were geotagged within each respective neighborhood. • However, the representations on the map are fictional—I placed coloured dots randomly on the neighborhood map for this mockup as the exact coordinates of each post were not available.
My Visible City • (See PDF “My Visible City”) • The data in this mockup is all fictional • I mocked these screens up to illustrate the possibilities of psychogeographically mapping a city at the individual level based on personal data. • Much of this data is already collected through an individual’s mobile phone through social media apps, transit apps, etc. It may be a matter of aggregating, consolidating and visualizing the data.