Download
1 / 20
200 likes | 213 Vues
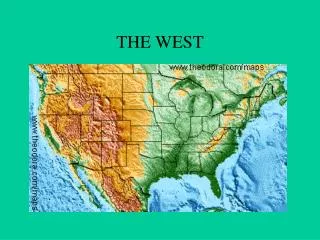
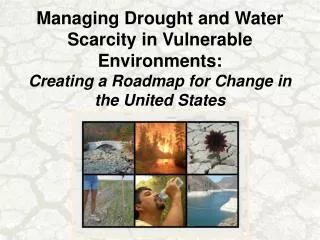
Explore the complexities of drought definitions, supply-demand dynamics, impacts on different sectors, and the need for historical context to develop effective water management strategies in the Western U.S.

E N D
“ … Just what is drought, in the West … ? “ Kelly Redmond Western Regional Climate Center Desert Research Institute Reno Nevada U.S. Drought Monitor Forum Portland Oregon 2007 Oct 10 – 11
What do we mean by drought in the West ? Well, what do we mean by drought, anywhere? We need, first of all, a single generic concept, applicable to all situations. We know, from experience, that drought has different manifestations in different circumstances. The generic concept will be played out differently in these different situations. For a given situation, there are multiple ways of portraying current circumstances, specific to the situation, the audience and the application. One size does not fit all needs exactly, though a single definition can be “good enough” for many applications. Which, or how many, of these applications is the Drought Monitor trying to reach? Specifically, what is the Drought Monitor intended to portray? And for what audience, and to what purpose?
Where’s the available water? On the surface Below the surface What is the rate of replenishment (supply) ? Precipitation Runoff Reservoir inflow Root zone and groundwater recharge What is the rate of usage (demand) ? Human needs (residential indoor / outdoor, industrial) Vegetation needs (evapotranspiration) Reservoir drawdown Groundwater withdrawal
What’s the Water Budget?: Supply rate minus demand rate If positive, things are OK (at least for now) If negative, then If buffers adequately full, things are OK (for now) If buffers are low, impacts beginning to occur If buffers are very low, impacts more serious If buffers are empty, severe/catastrophic impacts (Buffer = Reservoir/Lake, Root Zone, Deep Aquifer, Organism, Cell) Degree of Impact = Degree of Drought Drought is defined by its impacts No impact, no drought Drought: Insufficient water to meet needs (working definition) Transient or “permanent” condition? - permanent not possible Drought as a diagnostic concept (vs prognostic)
Much of drought is basically about the relationship between supply and demand. For each of the various sectors and applications concerned with the relationship between water supply and demand, there is a set of processes operating at characteristic temporal and spatial scales. There are many situations at once. These situations quite often involved lagged behavior (winter precipitation is the source of summer water) or issues of spatial distribution (precipitation in Wyoming is the source of drinking water for Los Angeles). In most cases, there cannot be a single time or space scale for drought. (In many cases, though, there is a dominant time or space scale.) The return values (Dx) vary from one time scale to another. We are frequently trying to average over a set of simultaneous situations, where averaging is not necessarily appropriate. This creates a need for ancillary products that more fully address different situations.
What is the relationship between water supply and demand? Not enough emphasis on demand. Local, County, State, Regional level impacts Uniformity from state to state (not now) Uniformity across sectors (major missing pieces) Not all impacts known immediately Costs associated with impacts (time lags here too) Scale mismatch – impacts vs data Takes skill to develop this information properly Reconciliation of impact indicators with geophysical indicators Are they telling the same story ? Is the picture consistent ? Impacts sometimes seen before physical clues apparent Physical clues sometimes tip off search for impacts Need for historical perspective … how unusual ? Thus, need histories. Proportionality of physical and impact indicators
Odds and ends: The California situation: Dominance by a single sector: Water Resources. When “Drought” is declared, certain legal directives are invoked. Buffering is present as a shield for seasonal (annual) water imbalance, and for multi-year imbalance. But, there are other sectors with little or no buffering: pastures, fire, etc. Natural systems vs. Human systems.
Sierra Nevada Winter-Centered 12-Month July - June Precipitation Thru June 2007
El Rio de las Mercedes The River of Mercy Merced River, California 6 October 2007
South Fork Merced River Wawona, Yosemite National Park 6 October 2007