Download
1 / 7
70 likes | 94 Vues
A reversed phase high performance liquid chromatography was developed for estimation and determination of two actives pharmaceutical<br>ingredient Udenafil (Zydena) and Dapoxetine (Priligy). In presence of pregabalin as internal standard. The chromatographic conditions were<br>applied according to ICH-guidelines using Thermo Hypersil BDSu2013C18 (250 mm u00d7 4.6 mm, 5.0 u00b5) the mobile phase containing acetonitrile:<br>0.2% triethyl amine in pure water (H2O) the adjusted pH was 4.4 using ortho- phosphoric acid (75: 25) with flow rate amount approximately 1<br>ml/min using UV detection at 246 nm. Limit of detection was established to be 0.015 u03bcg/ml and Limit of Quantification (LOQ) was found to be<br>0.025 u03bcg/ml for udenafil and the Limit of Detection (LOD) of dapoxetine HCl 0.020 u03bcg/ml. according to ICH-guidelines and statistical treatment<br>of date the date for this method was linear with correlation coefficient R2 > 0.99 which prove that the method is convenient and applicable for<br>the investigation and study of udenafil and dapoxetine HCl in drug formulation and commercials tablets found in Jordanian pharmaceutical<br>market beyond any interference or interaction with the additives materials or the excipients.<br>

E N D
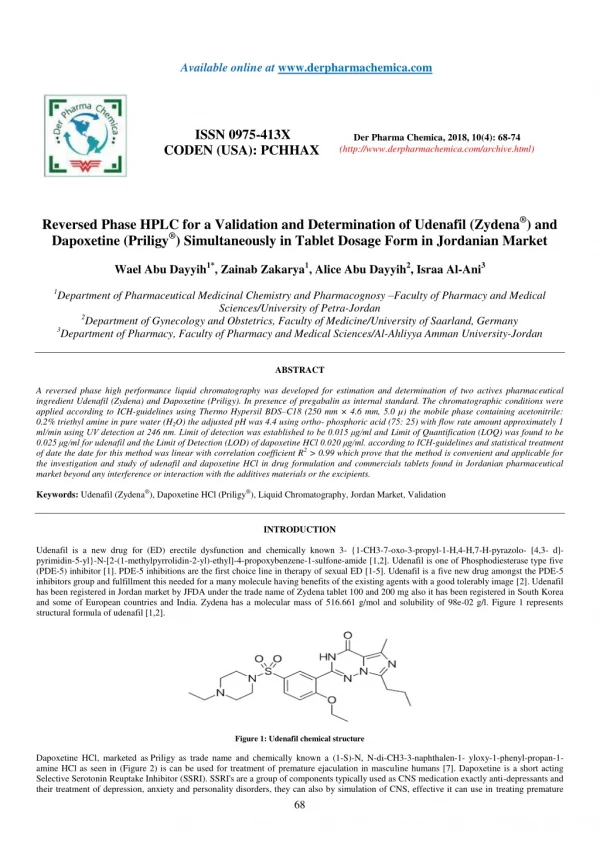
Available online at www.derpharmachemica.com ISSN 0975-413X CODEN (USA): PCHHAX Der Pharma Chemica, 2018, 10(4): 68-74 (http://www.derpharmachemica.com/archive.html) Reversed Phase HPLC for a Validation and Determination of Udenafil (Zydena®) and Dapoxetine (Priligy®) Simultaneously in Tablet Dosage Form in Jordanian Market Wael Abu Dayyih1*, Zainab Zakarya1, Alice Abu Dayyih2, Israa Al-Ani3 1Department of Pharmaceutical Medicinal Chemistry and Pharmacognosy –Faculty of Pharmacy and Medical Sciences/University of Petra-Jordan 2Department of Gynecology and Obstetrics, Faculty of Medicine/University of Saarland, Germany 3Department of Pharmacy, Faculty of Pharmacy and Medical Sciences/Al-Ahliyya Amman University-Jordan ABSTRACT A reversed phase high performance liquid chromatography was developed for estimation and determination of two actives pharmaceutical ingredient Udenafil (Zydena) and Dapoxetine (Priligy). In presence of pregabalin as internal standard. The chromatographic conditions were applied according to ICH-guidelines using Thermo Hypersil BDS–C18 (250 mm × 4.6 mm, 5.0 µ) the mobile phase containing acetonitrile: 0.2% triethyl amine in pure water (H2O) the adjusted pH was 4.4 using ortho- phosphoric acid (75: 25) with flow rate amount approximately 1 ml/min using UV detection at 246 nm. Limit of detection was established to be 0.015 μg/ml and Limit of Quantification (LOQ) was found to be 0.025 μg/ml for udenafil and the Limit of Detection (LOD) of dapoxetine HCl 0.020 μg/ml. according to ICH-guidelines and statistical treatment of date the date for this method was linear with correlation coefficient R2 > 0.99 which prove that the method is convenient and applicable for the investigation and study of udenafil and dapoxetine HCl in drug formulation and commercials tablets found in Jordanian pharmaceutical market beyond any interference or interaction with the additives materials or the excipients. Keywords: Udenafil (Zydena®), Dapoxetine HCl (Priligy®), Liquid Chromatography, Jordan Market, Validation INTRODUCTION Udenafil is a new drug for (ED) erectile dysfunction and chemically known 3- {1-CH3-7-oxo-3-propyl-1-H,4-H,7-H-pyrazolo- [4,3- d]- pyrimidin-5-yl}-N-[2-(1-methylpyrrolidin-2-yl)-ethyl]-4-propoxybenzene-1-sulfone-amide [1,2]. Udenafil is one of Phosphodiesterase type five (PDE-5) inhibitor [1]. PDE-5 inhibitions are the first choice line in therapy of sexual ED [1-5]. Udenafil is a five new drug amongst the PDE-5 inhibitors group and fulfillment this needed for a many molecule having benefits of the existing agents with a good tolerably image [2]. Udenafil has been registered in Jordan market by JFDA under the trade name of Zydena tablet 100 and 200 mg also it has been registered in South Korea and some of European countries and India. Zydena has a molecular mass of 516.661 g/mol and solubility of 98e-02 g/l. Figure 1 represents structural formula of udenafil [1,2]. Figure 1: Udenafil chemical structure Dapoxetine HCl, marketed as Priligy as trade name and chemically known a (1-S)-N, N-di-CH3-3-naphthalen-1- yloxy-1-phenyl-propan-1- amine HCl as seen in (Figure 2) is can be used for treatment of premature ejaculation in masculine humans [7]. Dapoxetine is a short acting Selective Serotonin Reuptake Inhibitor (SSRI). SSRI's are a group of components typically used as CNS medication exactly anti-depressants and their treatment of depression, anxiety and personality disorders, they can also by simulation of CNS, effective it can use in treating premature 68
Der Pharma Chemica, 2018, 10(4): 68-74 Wael Abu Dayyih et al. ejaculation problems, some cases of impotency in men and some cases hypnotics [7-9]. Figure 2: Dapoxetine chemical structure In previous studies shows that some methods reported for assay of udenafil and dapoxetine alone such as, quantification and stability indicating by reversed phase high pressure liquid chromatography/Rp-HPLC method for the determination of udenafil as active ingredient in in pharmaceutical preparation, some sensitive methods are recorded and some simple HPLC methods for validation of udenafil in human plasma or serum, more of stress degradation investigations on Udenafil and Estimation of stability- indicating LC analysis for drug formulation and pharmaceutical as dispensing dosage form and udenafil pharmacokinetics or dynamics in healthy volunteers, validation of a RP-HPLC assay for the determination of dapoxetine HCl in drug formulation, quantification of dapoxetine, an investigation parameters for treatment of CNS disorders as depression [8-10]. Many studies used term of Internal Standard (IS) which represent a chemical substance may be a drug which can be used for calibration curve by plotting the ratio of the target API signal to e internal standard signal as a function of the amount of the standards in the assay [8,11]. In the present study a simultaneous determination of udenafil and dapoxetine HCL by RP-HPLC in pharmaceutical preparation found in Jordan Market as tablet dosage form. The proposed method is validated as per International Harmonization guidelines (ICH) [12,13]. MATERIALS AND METHODS Materials Pure drug sample of Udenafil, Hikam Pharmaceuticals Group, Jordan, sample of B. No.: UDN/13-12/17 and from. Saudi Pharmaceutical Industries & Medical Appliances Corporation (SPIMACO) supply as a gift the dapoxetine HCl as pure drug sample of Batch No.: DPOX/41/11/17. Both was used without further purification because the assay certification shows that 99.91% (w/w) for udenafil and 98.99% (w/w) for dapoxetine HCl on dry phase. All chemicals or reagents which used in this study, were in term of HPLC grade and were purchased from Jordan and made by Merck Chemicals, Germany. Pregabalin was used as internal standard (IS) which obtained from Jordan Pharmaceutical Industries (JPM) B. No. 3584 as pure API powder, Figure 3 represent the structure formula of pregabalin. Figure 3: Pregabalin chemical structure Method and instrumentation The High Pressure LC, system included a Pump (Model JW-asco PIU 3080), Intelligent-Sensitive Liquid Chromatography pump with auto- sampler programmed at 10-20 µl capacity per injection was applied in the system. The transducer (detector) which used of UV/Vis (JW-asco UV 3070) this model operated and fixed at a wavelength of 246 nm. The collected date was used (JBV) Jasso Berwyn Version 1.8, LC-Net- III/ADLC system. The column used was Thermo Hypersil type-3-BDS-C18 (200 mm × 4.6 mm, 5.0 µ) made in Germany. Preparation of stock solutions (Standard) Stock solution (Standard) of optimal concentration 2500 µg/ml of udenafil, and 1500 µg/ml of dapoxetine HCl was obtained by using organic solvent (CH3OH). From the original standard stock solution, so the mixed solutions (standard) were obtained using mobile phase which has 2 µg/ml of udenafil and 4 µg/ml of dapoxetine HCl. Optimization of High Performance Liquid Chromatography (HPLC)-Method The HPLC method was optimized by development a simultaneous analysis method for determination of Udenafil and dapoxetine HCl, simultaneously. Mixed standard solution (stock) (2 µg/ml udenafil and 4 µg/ml dapoxetine HCl) was auto-injected in LC. For RP-HPLC, optimization the organic solvent Methanol (CH3OH) and pure water (H2O) was tested in ratio of 85: 15 but it found the result on the peak shape was not identical and correct due to the peak shape in this mixture is not good for the both of udenafil and dapoxetine. Hence pure water (H2O) was changed with a buffer solution (phosphate buffer). Organic solvent CH3OH: Phosphate (PO4) buffer pH 4.6 adjusted with ortho- phosphoric acid in the ratio of 85: 15 it was found the result of sharp peak was obtained for udenafil but, the result of dapoxetine HCl was hump shape peak obtained. After that the phosphate buffer was changed with tri-ethyl amine. Solvent Methanol 0.2% tri-ethyl amine in H2O pH adjusted to 4.5 with ortho-phosphoric acid in the ratio of 85: 15 was tested, the resulting sharp peak was observed for udenafil but slight tailing in peak was focused for HCl. In the Final of trails, CH3OH (Organic solvent of methanol) was changed to Acetonitrile (ACN) and the optimal mobile phase 69
Der Pharma Chemica, 2018, 10(4): 68-74 Wael Abu Dayyih et al. obtained was acetonitrile: 0.2% triethyl amine in water (H2O) at adjusted pH to 4.4 with ortho-phosphoric acid in the ratio 75: 25 V/V, with a flow rate 1.0 ml/min which provide an acceptable (tR) retention time), with high number of plates(N) and a better resolution (RS), more than another mobile phase tested before, for udenafil and dapoxetine HCl (Figure 3). The method validation The optimized validated HPLC method was accomplished with regarding to the following ICH-guideline criterion: Range and linearity The prepared stock solution standard (2500 µg/ml, udenafil and 1500 µg/ml, dapoxetine HCl) was else diluted to obtained udenafil and dapoxetine HCl concentration in the range of 0.30-6 µg/ml and 0.85-14 µg/ml, correspondingly. The results of Linearity in the optimization method was designed by injection of a six values of concentrations of the drug adapted in the mobile phase in three times or triplicate into the liquid chromatography system by keeping the injection volume stable. The peak areas were hatch against in the corresponding of the mention concentrations to achieve a good calibration curve. Precision Because the precision of a method can be verified by and intermediate and repeatability precision studies, the repeatability studies were behaved by the assay of three different concentrations low, mid high values of concentrations, 0.30, 3.0, 6.0 µg/ml for udenafil and 0.85, 6.0, 14.0 µg/ml for dapoxetine HCl, six times on the like day. Another term of precision is intermediate precision of the method which was analyse by repeating readings on three diverse days. Limits of Detection (LOD) and Quantification (LOQ) LOD and LOQ serve the concentration of the analyse API sample that would profit signal-to-noise(S/N) ratios of three for LOD and ten for LOQ, subsequently. To quantify the LOD and LOQ, consecutive dilutions of mixed prepared standard solution of udenafil and dapoxetine HCl was destined from the stock solution standard. The samples were injected in liquid chromatography system and deliberated signal from the samples was correlated with those of blank samples. Robustness of the present method To checkout one of the important parameters in validation according to ICH – guidelines, robustness of a HPLC method, petty parameter was purposely various. The parameters constituted changes of flow rate, percentage of the organic solvent (ACN) acetonitrile in the mobile phase and the other solvents from diverse part were appropriated. The parameter Robustness of the assay was effected at three different concentrations levels 0.30, 3.0, 6.0 µg/ml and 0.85, 6.0, 14.0 µg/Ml for udenafil and dapoxetine HCl, correspondingly. Specificity of the present method The specificity of the assay against the drug formula was entrenched over the study of resolution factor (Rs) of the drug peak and peak width from the adjacent resolved peak. The peak purity of udenafil and dapoxetine HCl, was steadfast by analysed the spectrum at three diverse regions of the blot i.e., Start peak (S), apex peak (A) and last peak (Peak end E) (L). Reaction and effect of excipients of the drug formulation was planned for whether it can be interfering with the assay of method. Accuracy of the present method Accuracy of this method was achieved by employ the method to drug analysed sample (Udenafil and Dapoxetine HCL consolidation tablet) to which known amount of Udenafil and Dapoxetine HCL standard powder reciprocal to 80, 100 and 120% (According to ICH-guidelines) of label claim had been added (Standard Addition Method -SAM), mixed and the powder was obtained and verified by running read out chromatogram in developed mobile phase. Analysis and determination of a commercials formulation To determine exactly the contended of udenafil and dapoxetine HCl in current and common tablet in Jordanian market (trade name: Zydena200 mg/tablet, requirement label: 200 mg udenafil and 60 mg/tablet dapoxetine HCl), 20 tablets were weighed for this test, their mean substances were determined and powdered. The weight of the tablet grind equivalent to 200 mg of udenafil and 60 mg dapoxetine HCl was removed into a 100 mL volumetric flask containing 45-50 ml CH3OH (Methanol, sonicated for 25 min and diluted up to 50 mL with CH3OH. The obtaining solution was centrifuged at (4000 rpm) time of 7 min and the API-content of the supernatant was decisive (250 and 1400 µg/ml for udenafil and dapoxetine HCl, correspondingly). Supernatant was appropriated and then a suitable dilution for the sample solution after filtered using 0.50- micron filter type (Millipore-Milford). The mention above solution stock was further diluted to get sample solution of 15 and 4 µg/ml for udenafil and dapoxetine HCl, correspondingly. 30 µl volume of solution sample was introduced by auto injection into HPLC, 6 times, with the same conditions described before. The areas of the peaks were measured at 246 nm and concentrations obtained in the samples were calculated using multilevel calibration curve indicating on the same HPLC system and in same time under the equivalent parameters and conditions using equation of linear regression. RESULTS AND DISCUSSION The development and validation for this method on estimation of udenafil and dapoxetine HCl simultaneously in marketed solid dosage form/tablets in the present study the mobile phase involving acetonitrile: 0.2% triethyl amine in H2O pH was adjusted to 4.4 with ortho- phosphoric acid as buffer solution in ratio of (75: 25). Figures 4 and 5, represents the chromatograms of the two API’s Udenafil (UDNF) and Dapoxetine HCL (DPXN) used in this method in suitable mobile phase in present of the Pregabalin (PGLN) as internal standard (IS). 70
Der Pharma Chemica, 2018, 10(4): 68-74 Wael Abu Dayyih et al. Figure 4: Chromatogram of udenafil and dapoxetine HCl Figure 4: Chromatogram of udenafil and dapoxetine HCl and pregabalin Linearity udenafil and dapoxetine HCl showed good correlation coefficient (R2=0.999 for udenafil and 0.997 for dapoxetine HCl) in given concentration range (0.30-6 µg/ml for udenafil, 0.85-14 µg/ml for dapoxetine hydrochloride). The mean values of the slope and intercept were 143712 ± 0.847 and 147669 ± 1.211 for udenafil and 42734 ± 0.9641 and 432842 ± 0.5422 for dapoxetine HCl, respectively. 71
Der Pharma Chemica, 2018, 10(4): 68-74 Wael Abu Dayyih et al. Figure 5: Linearity curve of dapoxetine HCl The experiments of precision parameters as repeatability and intermediate precision the results are shown in Table 1. Table 1: The results for repeatability and intermediate precision parameters Repeatability (n=6)/ measured concentration ± SD Intermediate precision (n=6)/measured concentration ± SD Concentration (µg/ml) %RSD Recovery % %RSD Recovery % Udenafil 98.90 99.10 98.89 Dapoxetine HCl 99.64 98.77 99.86 0.30 3.00 6.00 0.428 ± 0.89 0.897 ± 2.49 2.762 ± 4.98 1.61 1.02 1.36 0542 ± 1.23 0.984 ± 2.42 2.681 ± 2.75 1.12 0.99 1.67 99.31 98.97 99.43 0.85 6.00 14.0 0.799 ± 1.53 3.04 ± 3.67 9.08 ± 5.74 0.69 1.45 1.56 0.857 ± 3.27 2.713 ± 5.18 8.279 ± 2.53 1.19 1.28 1.92 102.77 100.74 99.57 The validated method was found to be precise as the Relative Standard Deviation (RSD) values for the parameters of repeatability and intermediate precision studies were < 2%, correspondingly according to the ICH-guidelines. LOD and LOQ The term N/S ratios (signal-to-noise) of 6:2 and 20:2 were pick up for the measure of parameters LOD and LOQ respectively. LOD and LOQ according to ICH-guidelines were established to be 0.015 μg/mland 0.035 μg/ml for udenafil and 0.020 μg/ml and 0.045 μg/ml for dapoxetine HCl correspondingly. The method robustness Any parameters selected (except columns from diverse suppliers) was modified at three levels according to ICH-guidelines (−1, 0 and 1). One parameter at the time was changed to evaluate the development. Hence, repeat injections at 6 trails (n=6) of mixed of standard solution at three known concentration ranges were performed under small deliberate modified of three chromatographic factors or parameters. These deliberated changes show an insignificant variation in the areas of the peak (PA) and fewer changeability in retention time (tr) were detected and observed, as mention above three factors were slightly changed at three levels too which (-1.0, 0.0,1.0) (Table 2a, 2b, 2c and 2d). Table 2a: Robustness parameters testing (n=3) for udenafil (Zydena®) tablet Retention time (tr)/min 0.90 -1.0 4.95 1.00 0.0 5.10 1.10 +1.0 5.05 Average ± SD (n=3) 5.03 ± 0.067 Table 2b: Robustness parameters testing (n=3) for dapoxetine HCl (Priligy®) tablet Retention time (tr)/min 0.90 -1.0 3.40 1.00 0.0 3.42 1.10 +1.0 3.39 Average ± SD (n=3) 3.40 ± 0.025 Table 2c: Robustness parameters testing (n=3) for udenafil (Zydena®) tablet % Acetonitrile (V/V) mobile phase (tr)/min 74 -1.0 5.07 Asymmetry factor (S) 1.56 1.83 1.65 1.68 ± 0.05 Flow rate (ml/min) Level Retention factor (tf) 0.17 0.12 0.10 0.30 ± 0.084 Asymmetry factor (S) 1.44 1.29 1.58 1.43 ± 0.13 Flow rate (ml/min) Level Retention factor (tf) 0.27 0.19 0.21 0.23 ± 0.037 Level Retention time Retention factor (tf) Asymmetry factor (S) 1.40 0.23 72
Der Pharma Chemica, 2018, 10(4): 68-74 0.10 0.07 0.30 ± 0.084 1.54 ± 0.07 Wael Abu Dayyih et al. 75 76 0.0 +1.0 5.10 5.12 1.71 1.52 Average ± SD (n=3) 5.97 ± 0.018 Table 2d: Robustness parameters testing (n=3) for dapoxetine HCl (Priligy®) tablet % Acetonitrile (V/V) mobile phase (tr)/min 74 -1.0 3.52 75 0.0 3.42 76 +1.0 3.34 Average ± SD (n=3) 3.43 ± 0.021 Retention time Asymmetry factor (S) 1.41 1.76 1.39 1.52 ± 0.02 Level Retention factor (tf) 0.37 0.12 0.41 0.30 ± 0.084 Specificity parameters According to ICH-guidelines requirements, peak purity requirements of udenafil and dapoxetine HCl was determined by correlating their corresponding spectra at the peak start(S), apex(A) and peak end(last)(E) positions i.e., r (S, A)=0.9986 and r (M, E)=0.9990. Good correlation (R=0.9988) was achieved between the standard sample and targeted sample spectra of udenafil and dapoxetine HCl, correspondingly. Also, the none active ingredient called excipients from the pharmaceutical formulation were not intrusive or interacting with the assay components. Recovery parameters As seen in the data obtained in Table 3a and 3b, there are a good recoveries parameters obtained of the udenafil collected date and dapoxetine HCl date in the range from 98.92 to 102.42% were realized at different combined concentrations. Table 3a: Recovery parameters studies for udenafil at n=6 Label request (claim) mg/tablet (mg) 200 160=80% 200 200=100% 200 240=120% Table 3b: Recovery parameters studies for dapoxetine HCL at n=6 Label request (claim) mg/tablet (mg) amount (mg) 60 48=80% 60 60=100% 60 72=120% Formulation assay The results obtained in this experiment of the quantity of udenafil and dapoxetine HCl in marketed tablets, expressed as a percentage of label request or claims were in acceptable agreement with the label request or claims by that implying that there are no interactions from any of additives or excipients which are ordinary present. The drug formulation content was to be 99.59% for udenafil and 102.33% for dapoxetine HCl. Two several lots of udenafil and dapoxetine HCl in tablets were testing using the scheduled procedures as seen in Table 4a and 4b. Table 4a: The assay of marketed tablets formulation of udenafil Amount established (mg/tablet), Amount measured Overall amount (mg) 360 400 440 Quantity recovered (mg) ± %RSD 37.60 ± 0.70 40.57 ± 1.10 44.23± 0.63 Recovery % 102.42 99.73 99.81 Amount measured Overall Quantity recovered (mg) ± %RSD 104.16 ± 1.11 121 ± 0.97 134.33 ± 0.74 Recovery % 109.45 120 137.21 99.37 100.59 98.92 Lot No. (Udenafil 200 mg) Recovery % Mean SD (n=6) 199.67 ± 1.23 200.11 ± 0.86 First Lot Second Lot 99.39 101.17 Table 4b: The assay of marketed tablets formulation of dapoxetine HCl Amount established (mg/tablet), Lot No. (Dapoxetine HCl 60 mg) Recovery % Mean SD (n=6) 59.81 ± 0.82 61.02 ± 0.21 First Lot Second Lot 100.41 101.62 CONCLUSION The HPLC method was easy developed and validated according to ICH-guidelines. By using UV-detection grant an accurate and precise determination of udenafil 200 mg in marketed formula (Zydena®) and dapoxetine HCl also in marketed formula (Priligy®). The method operation has been assessing in terms of the followings parameters which include linearity, accuracy, precision and robustness in order to confirm the suitability of this analytical method obtained. This validated method was also adjusted to the commercials and marketed samples. The method validated and development was selective and linear between concentration range 0.30-6 μg/ml for udenafil and 0.85-14 μg/ml for dapoxetine HCl with correlation coefficient more than 0.99. all the date obtained are in range of the acceptable values according to ICH- guidelines It may be continued this study for the degradation kinetics and interactions drug-drug or drug food or beverages of udenafil and dapoxetine HCl estimation in biological serum or other biological fluids. ACKNOWLEDGMENT 73
Der Pharma Chemica, 2018, 10(4): 68-74 Wael Abu Dayyih et al. The author would like to thank Faculty of Pharmacy and Medical Sciences-University of Petra; Jordan, Faculty of Medicine-Department of Gynecology and Obstetrics-University of Saarland, Germany and Faculty of Pharmacy and Medical Sciences-Al-Ahliyya Amman University- Jordan; for the facilities to finalize this project. REFERENCES [1] S.K. Bael, M.J. Kang, C.W. Yeo, M.J. Kim, J.H. Shon, K.W. Liu, J.G. Shin, Biomed. Chromatogr., 2008, 22, 939. [2] W.S. Ku, H.J. Cho, I.S. Yoon, J.H. Kim, B.J. Cha, J.S. Kim, K.M. Kim, S.K. Kang, S.J. Chung, C.K. Shim, D.D. Kim, Chem. Pharma. Bull. (Tokyo)., 2011, 59, 91083. [3] E.M. Mallah, W.S. Rayyan, W.A. Dayyih, F.D. Elhajji, K.M. Mansour, I.S. AL-Majali, T.A. Arafat, Lat. Am. J. Pharm., 2016, 35, 1277. [4] M. Hamad, A. Al-Sharqawi, W.A. Dayyih, E. Mallah, T. Arafat, J. Appl. Pharm. Sci., 2016, 6, 52. [5] E.M. Mallah, N. Al-Ani, W.A. Dayyih, N. Qinna, R. Awad, K. Sweidan, T. Arafat, J. Clin. Pharm., 2014, 1, 1007. [6] L. Hamilton, D. Cornpropst, J. Chromatogr. Biomed. Sci. Appl., 2010, 2, 612. [7] V.V. Kanani, V.P. Gohil, K.S. Muralikrishna, A. Deshmukh, Pharm. Anal. Qual. Assur., 2012, 1. [8] W.M. Zhang, W. Qiang, W. Ying-Fei, S. Ming, R. Wang, J. Pharm. Biomed. Anal., 2016, 5, 45. [9] M.J. Dresser, D. Desai, S. Gidwani, A.D. Seftel, N.B. Modi, Int. J. Impot. Res., 2006, 18, 104. [10] D. DeOrsi, M. Pellegrini, E. Marchei, P. Nebuloni, B. Gallinella, G. Scaravelli, A. Martufi, L. Gagliardi, S. Pichini, J. Pharm. Biomed. Anal., 2009, 15, 362. [11] K.T. Mahmood, B.A. Khan, Pak. J. Biol. Sci., 2010, 62, 192. [12] ICH, Guidance for Industry Q2B Validation of Analytical Procedures: Methodology, 1996, 1-12, (Incorporated in November, 2005). [13] ICH Harmonized Tripartite Guideline: Validation of analytical procedures: Text and methodology Q2 (R1), 1996, 1-17, (Incorporated in November, 2005). 74