Essential Graph Drawing Guidelines for Beginners
Learn the basic rules for drawing accurate graphs. Follow steps for axis, scale, labeling, plotting points, and titles in line and bar charts. Practice and master graphing skills!

Essential Graph Drawing Guidelines for Beginners
E N D
Presentation Transcript
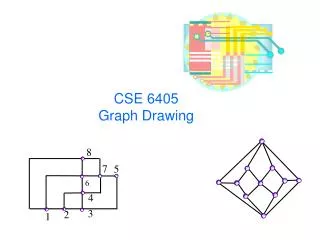
Drawing graphs…
RULES! RULES! • Draw your axis with a pencil and ruler. • Choose a sensible scale for each axis. (A little bigger than the biggest number.) • Label each axis with the units and name of what you were measuring. • Plot the points carefully with a pencil. • Join up the points for a line graph, colour in the blocks for a bar chart. (Leave a space between each bar to make it as neat as possible.) • Give the graph a title – in pen and underlined.
Have a go! • This is a Bar chart! • The colour of cars in my street.
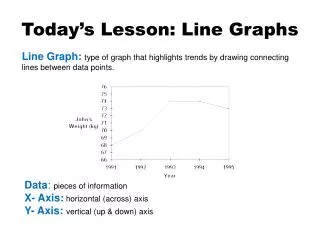
Have a go! • This is a Line graph! • It shows how substance “X” cools with time.