Download
1 / 17
170 likes | 331 Vues
July 2010 Report on Oasis Data for 2007,2008,2009 & 2010 (YTD May). Atlanta, Georgia July 20-21, 2010 R. Darrell Taylor Raytheon. ACTION ITEM: January- 2010 Report OASIS data over a 3 year time frame to determine if any trends exist. Executive Summary.

E N D
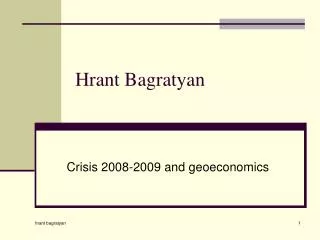
July 2010 Report on Oasis Data for2007,2008,2009 & 2010 (YTD May) Atlanta, Georgia July 20-21, 2010 R. Darrell TaylorRaytheon
ACTION ITEM: January- 2010 • Report OASIS data over a 3 year time frame to determine if any trends exist.
Executive Summary • The process has not changed statistically from 2008 to 2009 – 2007 was not normal in comparison • Majors are written app. Every 4 audits, seeing a change in 2010 • App. 3 Minors are written every audit, no change, consistent • Feedback usually closes quickly but a small percentage stay open for months
Agenda • CRB Activity • Entries – Audits • Nonconformities • Scores • AS9100 Elements • Feedback • Proposed Monitoring Model
Comparison of Entries 2007,2008, 2009 7 first 5 months 2010 • Entries: • 2007 – 5114 • 2008 – 4529 (DB error) • 2009 - 5001 • 2010 – 1385 • (as of May) As of May, only 27% of data in with 42% of year gone
Comparison of Types2007 -2010 SUR=Surveillance REC = Recertification INT = Initial If pace holds, we will have about ½ the number of initials
Standards Entered Into Database App. 2% increase in 9120 activity, note minimal data entry errors
Ratio- Total Nonconformities/Entries Totals 2010 – 13,166* 2009 -14,838 2008 -13,095 2007 – 14,957 * At current pace 2007 not normal, 214 10 or more majors, one with 20…
Ratio Majors/Entries Totals 2010 - 203 2009 -1135 2008 – 976 2007 - 870 On average, one Major is written every fourth audit – NOTE: Average up to 6.6 audits for 2010
Ratio Minors/Entries Totals 2010 – 3,352 2009 -13,703 2008 -12,119 2007 –14,087 On average, 2.8 Minors are written every audit, no significant change from the past
AS9100 Nonconformities Top 15 Top Ten 2009 same as 2008
Feedback Analysis 2008 2009 2007 2009 average 112 per month, none in December
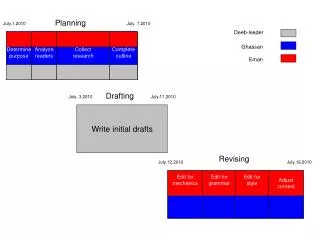
Time – Line, Data Presentation JAN MAR JUL SEP First 6 Months Summary Previous Year Summary RULE VIOLATORS
Certification Body Statistical Assessment Model General - 1 Criteria Feedback - 2 Criteria OASIS Results - 3 Criteria ANAB Audits - 6 Criteria
Threshold Violations • RMC & ANAB need to research • ANAB to report to RMC • ANAB to investigate • No Action
Take Aways • Data Entry – accuracy counts • Looking for Outliers • Increased oversight supported by data