Download
1 / 28
290 likes | 394 Vues
Discover the fundamentals, capabilities, and future prospects of GIS technology, essential for mapping, analyzing, and strategizing geographically referenced information effectively.

E N D
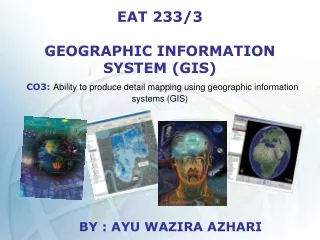
BY : AYU WAZIRA AZHARI EAT 233/3GEOGRAPHIC INFORMATION SYSTEM (GIS)CO3: Ability to produce detail mapping using geographic information systems (GIS)
GIS OVERVIEW • Concept of GIS • Components of GIS • Applications of GIS • Advantages of GIS • Future of GIS
CONCEPT OF GIS Geographic The Real World Information Data System Technology Support System
What is GIS? • A geographic information system (GIS) integrates hardware, software, and data for capturing, managing, analyzing, and displaying all forms of geographically referenced information. • GIS technology integrates common database operations such as query and statistical analysis with the unique visualisation and geographic analysis benefits offered by maps. • These abilities distinguish GIS from other informationsystems and make it valuable to a wide range of public and private enterprises for explaining events, predicting outcomes, and planning strategies.
Defining GIS “A GIS is designed for the collection, storage, and analysis of objects and phenomena where geographic location is an important characteristic or critical to the analysis.” Stanley Aronoff “Computer tool for managing geographic feature location data and data related to those features.” Allan B. Cox GIS is a tool for managing data about where features are (geographic coordinate data) and what they are like (attribute data), and for providing the ability to query, manipulate, and analyze those data.
What Can You Do With GIS? • Map where things are Mapping where things are lets you find places that have the features you're looking for, and to see where to take action. Figure 1: Maps of the locations of earthquake shaking hazards are essential to creating and updating building codes used in the United States
Map quantities People map quantities, like where the most and least are, to find places that meet their criteria and take action, or to see the relationships between places. Figure 2: This map shows the number of children under 18 per clinically active pediatrician for a particular study area
Map densities A density map lets you measure the number of features using a uniform areal unit, such as acres or square miles, so you can clearly see the distribution. Figure 3: This map shows population density in the east Asian and Indian Ocean regions.
Find what is inside Use GIS to monitor what is happening and to take specific action by mapping what's inside a specific area. Figure 4: This image from The Sanborn Map Company, Inc., shows a geoprocessed sample explosion radius around an area in California.
Find what is nearby Find out what's occurring within a set distance of a feature by mapping what is nearby. Figure 5
Map change Map the change in an area to anticipate future conditions, decide on a course of action, or to evaluate the results of an action or policy. Figure 6: The figures show the severe change in land use on Cape Cod since 1951. The image on the left shows the town of Barnstable in 1951 and the image on the right shows Barnstable in 1999.
Hardware Hardware: The machinery on which GIS operates. • The minimum configuration for a project requires a way to input data, support for management and analysis, and tools for output.
Software Software: The computer programs needed to run GIS. • GIS software provides the functions and tools needed to store, query,display, analyze, create and modify data. • Key software components are: • tools for the input, manipulation, and output of geographic data • a database management system (DBMS) • tools for geographic query, analysis, and visualization • a graphical user interface (GUI) for easy access to tools • tools to document data sources and quality (metadata)
Data Data: Data is the heart of GIS operation. • Major emphasis in GIS operations is on the data, from input through analysis, and ultimately to the presentation. • A GIS will integrate spatial data with other data resources and can even use a DBMS, used by most organizations to organize and maintain their data,to manage spatial data.
Method Method: The various procedures, techniques, and ways of using GIS and GIS data in applications. • The questions asked will determine the methods used to answer them. • Methodology can also determine the data to be used.
People • GIS technology is of limited value without the people who manage the system and develop plans for applying it to real world problems. • GIS users range from technical specialists who design and maintain the system to those who use it to help them perform their everyday work.
APPLICATIONS OF GIS Figure 7: Application areas for GIS
Environmental GIS • GIS is used every day to help protect the environment. • As an environmental professional, you can use GIS to produce maps, inventory species, measure environmental impact or trace pollutants. • The environmental applications for GIS have only begun to be explored.
Figure 9: Example on the role of GIS in data integration and pre-processing of inputs for the hydraulic modelling
ADVANTAGES OF GIS • GIS allows us to view, understand, question, interpret, and visualize data in many ways that reveal relationships, patterns, and trends in the form of maps, globes, reports, and charts. • A GIS helps you answer questions and solve problems by looking at your data in a way that is quickly understood and easily shared. • GIS technology can be integrated into any enterprise information system framework.
FUTURE OF GIS Predictions for GIS: Conceptual and Technical Predictions • Data models will be developed to handle 3D and time characteristics, and complex interactions between objects. • There will be new analysis and support functions to allow. • There will be support for quality assurance and quality control. • Support for multimedia will become common. • GIS and GPS developments will occur. GIS and GPS will be integrated for data collection and compilation, and a
decline in mass digitizing will be accompanied by a growth in use of GPS. • Tools for visualizing 3D and time-dependent data will be developed. • There will be convergence in general-purpose GIS, with most systems running under Unix and functionality becoming more similar. • Sector-specific products will probably appear. Figure 10: Example 3D object modelling in MapInfo using Encom’s Engage3D add-on
Data Prediction • Digitizing will be done where it is cheapest. • The data volume problem will disappear in some applications (due to, for instance, CD-ROM). • Ownership of data will become an issue, and data issue will continue to be affected by government policies. • Concern over privacy and confidentiality of data will be an issue in socio-economic applications.
Human and Organizational Issues • Improved techniques will become available for the GIS acquisition and project management process. • GIS will become part of wider management information systems in many organizations. • The skills and professionalism of individuals involved will influence the success of applications. • Education and training will have to concentrate on setting and demonstrating standards as well as curriculum content.
CONCLUSIONS • GIS is rapidly becoming a key technology to support decision making at all scales • The near future will continue to see accelerating growth in data availability and computing power to support GIS • The strategic decision to make now is not whether, but when and how to use GIS to support environmental studies and decisions