Comprehensive Guide to OLS and Poisson Regression Using Specialized Statistics Software
This interactive guide provides an in-depth understanding of Ordinary Least Squares (OLS) regression and its application to Poisson regression models, alongside notable statistical theories such as Classical Test Theory and Item Response Theory. It showcases various specialized software tools, including TESTFACT and BILOG-MG, for structural equation modeling and hierarchical linear modeling. Through practical examples, including confidence interval calculations, the guide elucidates the significance of predictors, such as age in the Gesell score analysis, enhancing your skills in statistical modeling.


Comprehensive Guide to OLS and Poisson Regression Using Specialized Statistics Software
E N D
Presentation Transcript
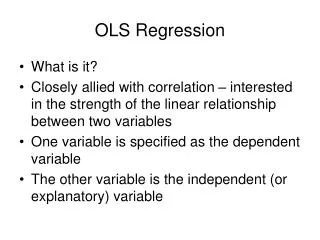
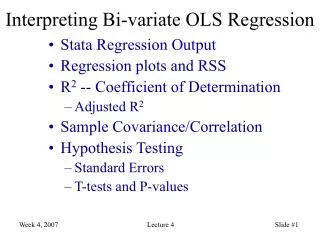
Interactive graphics Understanding OLS regression Normal approximation to the Binomial distribution
General Stats Software example: OLS regression example: Poisson regression as well as specialized software
Specialized software Testing: • Classical test theory – ITEMIN • Item response theory • BILOG-MG • PARSCALE • MULTILOG • TESTFACT
Specialized software Structural equation modeling (SEM)
Specialized software Hierarchical linear modeling (HLM)
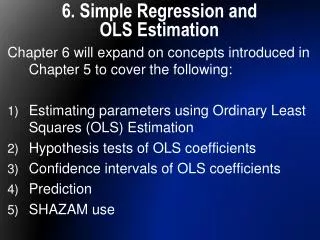
Output Age accounts for about 37.9% of the variability in Gesell score The regression model is significant, F(1,19) = 13.202, p = .002 The regression equation: Y’=109.874-1.127X Age is a significant predictor, t(9)=-3.633, p=.002. As age in months at first word increases by 1 month, the Gesell score is estimated to decrease by about 1.127 points (95% CI: -1.776, -.478)
Click to execute Enter the data Fit a Poisson loglinear model: log(Y/pop) = + 1(Fredericia) + 2(Horsens) + 3(Kolding) + 4(Age)
G2 = 46.45, df = 19, p < .01 City doesn’t seem to be a significant predictor, whereas Age does.
Plot of the observed vs. fitted values--obviously model not fit
Fit another Poisson model: log(Y/pop) = +1(Fredericia) + 2(Horsens) + 3(Kolding) + 4(Age) + 5(Age)2 Both (Age) and (Age)2 are significant predictors.
Fit a third Poisson model (simpler): log(Y/pop) = + 1(Fredericia) + 2(Age) + 3(Age)2 All three predictors are significant.
Item Response Theory Person Ability Easy item Hard item Item Difficulty Low ability person: easy item - 50% chance
Item Response Theory Person Ability Easy item Hard item Item Difficulty Low ability person: moderately difficult item - 10% chance High ability person, moderately difficult item 90% chance
Item Response Theory 100% - 50% - Probability of success Item difficulty/ Person ability 0% - -3 -2 -1 0 1 2 3 Item