Download

1 / 10
100 likes | 196 Vues
This study explores the factors influencing the percentage of the population with sustainable access to water, focusing on prosperity, education, and governance as significant determinants. Findings from various research studies are used to analyze the correlation between education, socio-economic standing, and water source types on water access. Using regression analysis, the study reveals the significant impact of GDP and literacy rates on water access, providing policy implications for improving education and investment strategies to enhance water accessibility.

E N D
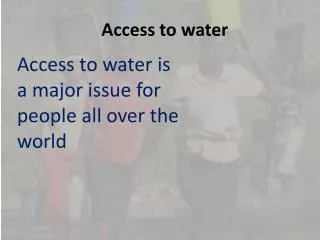
Determinants of Water Access Brian Banks bb4934a@american.edu American University School of International Service
Research Question & Hypothesis • What factors determine the percent of the population with sustainable access to water? • Hypothesis: Prosperity, education, and governance are significant determinants of water access.
Background Info or Lit. Review • Theory and Findings from: Decentralization on Access to Rural Water Supply Services: A Study of Six Villages in West Bengal, India • Theory: Access to water at the individual level is positively correlated with education, socio-economic standing (caste), and participation in local government. • Findings: The type of water source was found to be significant in all models, and education was significant in one model. • Theory and Findings from: International Investments in the Water Sector • Theory: Health impacts from water investment witness an “S” shaped curve, with both a threshold and a saturation point • Findings: Logistic curve had an R2 value of 50% for low access countries and 56% in high access countries. Both were significant, although, of note, N=65.
Data • Unit of Analysis: Country • Source: Pippa Norris Democracy Cross-national Data 2008 • Dependent variable is % of population with sustainable access to an improved source of water • Unit of measurement is % of population, and this is interval-ratio level • Independent Variables: • Gross Domestic Product per capita (purchasing price parity), in year 2000 dollars, and this is interval-ratio level. • Adult literacy rate 1998, and this is interval-ratio level. • Transparency International Corruption Perception Index for 2007, which is interval ratio.
Bivariate analysis Pearson’s Correlation (Significance) [N]
Regression Analysis, % of Population with Access to Sustainable Clean Water
Findings & Policy Implications of the research • Findings: GDP and Literacy were both significant at alpha=.05, and this model explains 46.8% of differences in water access. • Policy: • Improving the education will, in turn, improve water access, providing an opportunity to reach two objectives with one investment. • Investment may have better outcomes in countries with higher GDP per capita and higher literacy rates, increasing return on investment.