Download
1 / 31
310 likes | 427 Vues
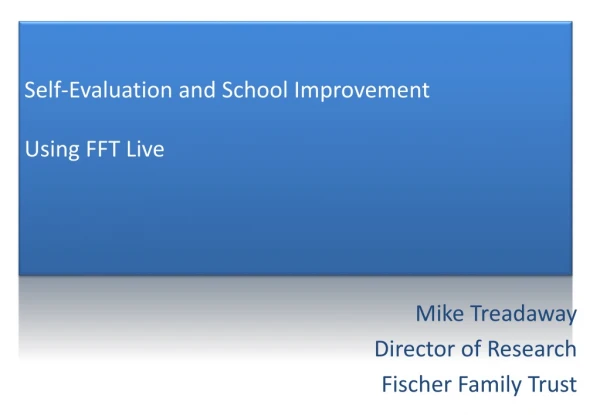
Explore the transformative power of FFT Live in self-evaluation for schools. Led by Mike Treadaway, Director of Research at Fischer Family Trust, this comprehensive overview delves into key analyses and value-added reports that inform school improvement strategies. Discover essential methodologies for calculating grade estimates, utilizing ordinal regression while addressing accuracy and fairness in evaluating diverse teaching groups. Understand the implications of these insights on students' performance across subjects and how data-driven decisions can lead to significant educational advancements.

E N D
Self-Evaluation and School ImprovementUsing FFT Live Mike Treadaway Director of Research Fischer Family Trust
FFT Live – Key Analyses Secondary
KS4 (and KS5) Subject VA and Estimates Value Added To Single Grade or Not to Single Grade? Estimates
Single Grade Estimates: Database • Single Grade estimate in the database • Calculated for subject groups
FFTLive • FFTLive introduced a full range of probabilities
FFTLive – Single Grade • Highlight the highest probability
Narrowing to the Middle • Let’s imagine a class of 10 pupils with exactly the same estimates to Billy Onion • Highlighted grade exported to the school MIS • The subject teacher sees.....
Narrowing to the Middle Estimates should be averaged across the group
Adding up highest probability grades Too few A*/A and F/G grades
Calculating Points (from ordinal regression) Issues – Accuracy and Fairness Particularly if used in context of evaluating progress of different teaching groups
Analysing Subject VA • A common approach is to use ordinal regression • Issues with this are: • Fails (U grades) • Linearity • Granularity • Intervals
Fails and Linearity • KS2 Average English Level • Similar pattern for over 80% of GCSE subjects at KS4 • Using linear regression introduces significant errors for A*, A and G grades
Granularity • Regression Analysis (OLS) works well where inputs AND outputs are on a continuous scale • Inputs are OK (fine grades) • Outputs are not – they are in clusters (grades) • If we had e.g. UMS points … but we don’t! Mathematics (random sample of 1000 records) KS2 -> KS3 KS2 -> KS4
Intervals Is the difference between A*/A, C/D and F/G grades the same? Yes No Not sure, but probably no Yes 60% <10% 30% Responses are what we find whenever we ask subject leaders this question We can debate whether or not their ‘gut feelings’ are justified If, though, we can find a method of analysis which doesn’t care whether or not grade intervals are equal………
Solution Nominal Regression Outputs are chances not estimated points