
Statistics: Essentials & Applications
E N D
Presentation Transcript
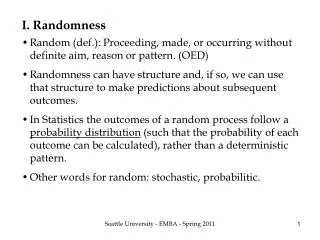
Statistics • Statistics is a part of mathematics. Many fields of science do tests or measurements. Statistics is a collection, analysis, interpretation or explanation of data (the word data means "pieces of information“). Types of data include numbers, words, sounds and images. • Statistics can help in two basic ways: • It can help to describe the results. This part is known as DescriptiveStatistics. Descriptive statistics is about finding meaningful ways to summarize the data, because it is easier to use the "summary" than having to use the whole set of data all the time. Summarizing the data also allows to find common patterns. In Statistics, such patterns are called probability distributions. The basic idea is to look at the results of an experiment and look at how the results are grouped. • Once the results have been summarized, and described they can be used for prediction. This is called InferentialStatistics. As an example, the size of an animal is dependent on many factors. Some of these factors are controlled by the environment, but others are called by inheritance.
History Statistics has been in use for a long time. The first known statistics are census data. The Babylonians did a census around 3500BC, the Egyptians around 2500 BC, and the Ancient Chinese around 1000 BC.
Collecting data • Before we can describe the world with statistics, we must collect data. The data that we collect in statistics are called measurements. After we collect data, we use one or more numbers to describe each observation or measurement. For example, suppose we want to find out how popular a certain game is. We can pick a group of people (called a sample) out of the total population of players. Then we ask each one how often they play the game.
Methods Most often we collect statistical data by doing surveys or experiments. To do a survey, we pick a small number of people and ask them questions. Then, we use their answers as the data. The choice of which individuals to take for a survey or data collection is important, as it directly influences the statistics. When the statistics are done, it can no longer be determined which individuals are taken. Suppose we want to measure the water quality of a big lake. If we take samples next to the waste drain, we will get different results than if the samples are taken in a far away, hard to reach, spot of the lake. There are two kinds of problems which are commonly found when taking samples: • If there are many samples, the samples will likely be very close to what they are in the real population. If there are very few samples, however, they might be very different from what they are in the real population. This error is called a chanceerror . • The individuals for the samples need to be chosen carefully, usually they will be chosen randomly. If this is not the case, the samples might be very different from what they really are in the total population. This is true even if a great number of samples is taken. This kind of error is called bias.
Errors • We can reduce chance errors by taking a larger sample, and we can avoid some bias by choosing randomly. However, sometimes large random samples are hard to take. And bias can happen if some people refuse to answer our questions, or if they know they are getting a fake treatment. These problems can be hard to fix.
Descriptive Statistics • Finding the spread of the data Another thing we can say about a set of data is how spread out it is. A common way to describe the spread of a set of data is the standard deviation. If the standard deviation of a set of data is small, then most of the data is very close to the average. If the standard deviation is large, though, then a lot of the data is very different from the average. If the data follows the common pattern called the normal distribution, then it is very useful to know the standard deviation. If the data follows this pattern (we would say the data is normally distributed), about 68 of every 100 pieces of data will be off the average by less than the standard deviation. Not only that, but about 95 of every 100 measurements will be off the average by less than two times the standard deviation, and about 997 in 1000 will be closer to the average than three standard deviations.
Finding the middle of the data The middle of the data is called an average. The average tells us about a typical individual in the population. There are three kinds of average that are often used: the mean, the median and the mode. Other descriptive statistics We also can use statistics to find out that some percent, percentile, number, or fraction of people or things in a group do something or fit in a certain category. For example, social scientists used statistics to find out that 49% of people in the world are males.
Nightingale, Florence • Quetelet, Adolph
Florence Nightingale Her life • Florence Nightingale was born into a rich, upper-class, well-connected British family at the Villa Colombaia in Italy, and was named after the city of her birth. Florence's older sister Frances Parthenope had similarly been named after her place of birth, Parthenopolis, a Greeksettlement now part of the city of Naples. • Her parents were William Edward Nightingale, born William Edward Shore (1794–1874) and Frances Nightingale née Smith (1789–1880). William's mother Mary née Evans was the niece of one Peter Nightingale, under the terms of whose will William inherited his estate Lea Hurst in Derbyshire, and assumed the name and arms of Nightingale. Fanny's father (Florence's maternal grandfather) was the abolitionist and UnitarianWilliam Smith. Inspired by what she took as a call from God in February 1837 while at Embley Park, Florence announced her decision to enter nursing in 1844, despite the intense anger and distress of her mother and sister. In this, she rebelled against the expected role for a woman of her status, which was to become a wife and mother. Nightingale worked hard to educate herself in the art and science of nursing, in spite of opposition from her family and the restrictive societal code for affluent young English women. Nightingale was courted by politician and poet Richard Monckton Milnes, 1st Baron Houghton, but she rejected him, convinced that marriage would interfere with her ability to follow her calling to nursing.
A PASSIONATE STATISTICIAN • When Florence Nightingale arrived at a British hospital in Turkey during the Crimean War, she found a nightmare of misery and chaos. • When Nightingale returned from the war, she was obsessed with a sense of failure, even though the public adored her. • So she began a campaign for reform. She persuaded Queen Victoria to appoint a Royal Commission on the Army medical department, and she herself wrote an 830-page report.
HER INVETIONS • Under Farr’s tutelage, Nightingale compiled vast tables of statistics about how many people had died, where and why. Many of her findings shocked her. For example, she discovered that in peacetime, soldiers in England died at twice the rate of civilians — even though they were young men in their primes. The problem with the military health service, she realized, extended far beyond a few terrible hospitals during a war. • Among other things she used the pie chart, which had first been developed by William Playfair in 1801. While taken for granted now, it was at the time a relatively novel method of presenting data. • a true pioneer in the graphical representation of statistics(polar area diagram) occasionally referred as the Nightingale rose diagram, equivalent to a modern circular histogram, in order to illustrate seasonal sources of patient mortality in the military field hospital she managed.
Explanation • The polar area diagram is similar to a usual pie chart, except sectors are equal angles and differ rather in how far each sector extends from the center of the circle. The polar area diagram is used to plot cyclic phenomena (e.g., count of deaths by month). For example, if the count of deaths in each month for a year are to be plotted then there will be 12 sectors (one per month) all with the same angle of 30 degrees each. The radius of each sector would be proportional to the square root of the death count for the month, so the area of a sector represents the number of deaths in a month. If the death count in each month is subdivided by cause of death, it is possible to make multiple comparisons on one diagram, as is clearly seen in the form of polar area diagram famously developed by Florence Nightingale.
Specialties • In 1859 Nightingale was elected the first female member of the Royal Statistical Society and she later became an honorary member of the American Statistical Association.
In general • Lambert Adolph Jacques Quetelet (22 February 1796 – 17 February 1874) was a Belgianastronomer, mathematician, statistician and sociologist. He founded and directed the Brussels Observatory and was influential in introducing statistical methods to the social sciences. His name is sometimes spelled with an accent as Quételet.
Contribution to the development of statistics The new science of probability and statistics was mainly used in astronomy at the time, to get a handle on measurement errors with the method of least squares. Quetelet was among the first who attempted to apply it to social science, planning what he called a "social physics". He was keenly aware of the overwhelming complexity of social phenomena, and the many variables that needed measurement. His goal was to understand the statistical laws underlying such phenomena as crime rates, marriage rates or suicide rates. He wanted to explain the values of these variables by other social factors.
His documents His most influential book was Sur l'homme et le développement de sesfacultés, ouEssai de physique sociale, published in 1835 (In English translation, titled Treatise on Man). In it, he outlines the project of a social physics and describes his concept of the "average man" (l'homme moyen) who is characterized by the mean values of measured variables that follow a normal distribution. He collected data about many such variables.
Thorvald N. Thiele • Born in 1838 and died in 1910 • Danish astronomer, mathematician and actuary • Most notable for his work in statistics, interpolation and the three-body problem • The first one to purpose a mathematical theory of the Brownian motion
The Brownian motion Why? Thiele wanted to create a model to describe observation errors from a sequence of measurements collected trough time. Applications: The brownian motion has different real-world applications. Stock market fluctuations. It is the random movement of particles in a fluid or the mathematical theory, which is used to describe random movements – called a particle theory. It is related to the normal distribution and described by the Wiener Process (a continuous-time stochastic process)