Download
1 / 15
150 likes | 177 Vues
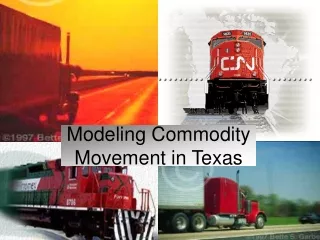
Explore the transportation dynamics of agricultural, hazardous, and construction materials in Texas using GIS for strategic planning and measuring the impact of different scenarios on commodity flows.

E N D
Modeling Commodity Movement in Texas Zenia Hernandez GIS in Water Resources
Geographic Information Systems (GIS) + Planning Modeling and Logistics Applications TransCADTransportation GIS Software • Contents: • TransCAD GIS- create and edit maps and geographic data sets, produce thematic maps, and perform spatial and geographical analysis • Extended Data Model-storage and tools • Transportation Analysis and Modeling-networks and operations research • Data-library of geographic, demographic and transportation data • Custom Application Development-programming
Modeling Commodity Flows GIVEN: • Origin-Destination Commodity Movement Models Commodity 1: Agricultural and Related Products Commodity 2: Hazardous Materials Commodity 3: Construction Materials • Origin and destination zone characteristics • Tonnage movement between origin county and destination county • Rail and road networks and minimum paths Determine and visually represent commodity flows for rail and road
Data Sources • Census of Population and Housing • National highway and rail networks • Boundaries for states and counties • Bureau of Economic Analysis (BEA) • Economic Census • GEOSTAT (Geospatial and Statistical Data Center)-Regional Economic Information System
Utility (“Attractiveness”) Utility=0+1x1+2x2…
Tonnage Movements by Mode Assumptions: • Capacity of a railcar is 100 tons. • Capacity of truck is 40 tons.
Desire Lines • Desire lines illustrate the flows of people or goods from point to point based on the values from a matrix. • In this case, desire lines show the flow of different commodities between counties in Texas.
Why Model Commodity Flows? • Analyzing the impact of a new highway network or rail network depending on commodity flows before constructing it. • Predicting future commodity flows. • Presenting ideas to policy-makers.


![[Commodity Name] Commodity Strategy](https://cdn3.slideserve.com/6088618/commodity-name-commodity-strategy-dt.jpg)