Download
1 / 60
1.08k likes | 1.98k Vues
Canine and Feline Electrocardiography. Special Topics. Applications of the Electrocardiogram. Acute onset of dyspnea Shock Fainting or seizures Monitoring during and after surgery (monitors depth of anesthesia as well as cardiac monitoring). All cardiac murmurs

E N D
Canine and Feline Electrocardiography Special Topics
Applications of the Electrocardiogram • Acute onset of dyspnea • Shock • Fainting or seizures • Monitoring during and after surgery (monitors depth of anesthesia as well as cardiac monitoring). • All cardiac murmurs • Cardiomegaly that is found on thoracic radiographs • Preoperatively • Cyanosis
Applications of ECG continued • Evaluating effect of cardiac drugs • Periocardiocentesis • Systemic diseases • Examples? • Electrolyte disturbances • What electrolyte have we discussed that may cause ECG abnormalities?
Review of Circulatory System • Body depends on the heart pumping oxygenated blood to the tissues • Unoxygenated blood enters the right side of the heart and is pumped to the lungs (pulmonary circulation) • From the lungs, the newly oxygenated blood enters the left side of the heart where it is pumped to the organs and tissues via systemic circulation.
Conduction System of the Heart • Electrical impulses are transmitted through the heart via specialized conduction cells in a specific sequence: • Sinoatrial (SA) node • Interatrial and internodal conduction tracts • Atrioventricular (AV) node • Bundle of His • Left and right bundle branches • Purkinje fibers
Remember Depolarization vs Repolarization? • Depolarization- heart muscle contraction in response to electrical stimulus. • Occurs when electrolytes move across the cell membrane (sodium/potassium pump). • Repolarization- heart muscle relaxation occurs when the electrolytes move back across the ce3ll membrane rendering the cell ready for the next electrical impulse.
Five Physiologic Properties of Cardiac Muscle • 1. Automaticity • SA node is the primary pacemaker of the heart, but any cells of conduction system can initiate their own impulses under right circumstances • The further down in the conduction system, the slower the rate of automaticity • 2. Excitability • Cardiac muscle is excited when the electrical stimulus reduces the resting potential to the threshold potential • The degree of the resting potential within the cell determines its excitability and obeys the “all-or-none” law.
3. Refractoriness • Heart muscle will not respond to external stimuli during its period of contraction • 4. Conductivity • Activation of an individual muscle cell produces activity in the neighboring muscle cell. • Conduction velocity varies in the different portions of the specialized conduction system and muscle fibers • Velocity is greatest in the Purkinje Fibers and least in the mid-portion of the AV node • Activation sequence is so arranged that the maximum mechanical efficiency is provided from each corresponding contraction
5. Contractility • Occurs in response to electrical current • Remember that the ECG only measures the stimulus for contraction- not the actual contraction itself. • ECG is the tool of choice for measuring contractility.
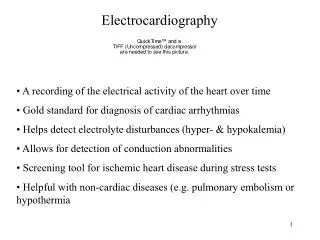
Electrocardiogram • Definition: Graphic recording of electrical potentials produced by heart muscle during the different phases of the cardiac cycle. • The voltage variations are produced by depolarization and repolarization of individual muscle cells • Each portion of the electrocardiogram thus arises from a specific anatomic or physiologic area of the heart
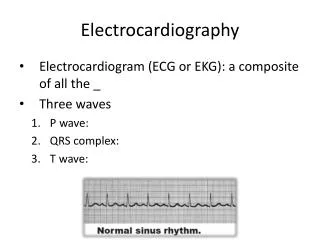
Portions of ECG • P wave- corresponds to atrial depolarization or contraction. • May be positive, negative or biphasic depending on the lead • QRS waves- corresponds to ventricular depolarization or contraction • Q wave- first negative deflection • R wave- first positive deflection • S wave- negative deflection that follows the R wave • T wave- corresponds with ventricular repolarization or relaxation • Every QRS complex HAS to have a T wave following it.
ECG Leads • Lead systems allow you to look at the heart from different angles. Each different angle is called a lead. Different leads can be compared to radiographs taken from different angles, such as lateral and dorsoventral thoracic radiographs taken for evaluation of cardiac chambers. • Each lead has a positive and negative pole attached to the surface of the skin, which can then be used to measure the spread of electrical activity within the heart.
Leads and the ECG • Upward deflection on ECG- produced when electrical impulses travel towards a positive electrode • Downward deflection on the ECG- produced when electrical impulses travel towards a negative electrode. • Flat line (isoelectric line)- produced when there is no electrical spread through the heart, or if the electrical forces are equal.
Standard ECG’s • To determine the mean electrical axis it is necessary to run the 3 standard bipolar leads as well a the 3 augmented unipolar limb leads. • Lead I- right arm (+) compared to left arm (-). • Lead II- right arm (-) compared to left leg (+), • Lead III- left arm (-) compared to left leg (+) • aVR-right arm (+) compared to point halfway between right arm and left leg (-) • aVL- left arm (+) compared to a point halfway between left arm and right arm. • aVF- left leg (+) compared to a point halfway between left arm and right arm (-). • Only lead II is needed to assess arrhythmias and lead I is the most importan lead
Generation of the ECG • Initiation of the impulse in the primary pacemaker (SA node) • Transmission of the impulse through he specialized conduction system of the heart • Activation or depolarization of the atrial and ventricular myocardium • Recovery or repolarization of the preceding three areas.
Types of ECG • ECG may be performed with “leads”- which are thin cables that attach to the patient’s limbs. • Some ECG machines may attach directly to the chest wall. These types of machines may be used for a monitoring period in which the heart is being evaluated over a set amount of time (24 hour period). • The number of leads depends on the type of machine that is being used. • Each lead is marked to a specific are and should be attached correctly, otherwise the results will be incorrect.
Performing an ECG • The animal should be standing or in right lateral recumbency. • Alcohol or conductive gel should be used so that there is better contact with the skin between the skin and the leads. • Typical recordings should be a minimum of 30 seconds but a good recording should be about 2 minutes long. • Some ECG link to a telephone system so results may not be immediately available. However most ECG graphs can be interpreted in clinic.
Considerations • Center the recording on the paper (if using paper printout) so that both the top and bottom of the waveforms can be seen. Adjust the position control if the tracing wanders • Decrease the sensitivity to ½ cm=1 mv if the QRS complexes go off the paper • Increase the length of the tracing if an arrhythmia is seen • R waves should be positive on lead I. If negative, check the lead wires to determine whether they are attached to the correct limbs. If connections are correct, then a true abnormality exists.
Summary video to this point • http://www.youtube.com/watch?v=nK0_28q6WoM&feature=related
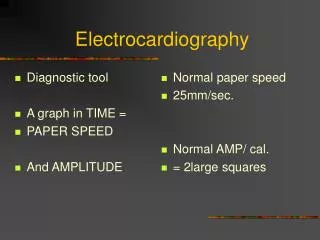
ECG Paper and Standardization • Standardization Signal • Without a standardization signal, the ECG paper is merely graph paper. By entering a signal, you place value on each of the smallest squares. • At 1 cm=1 mv each tiny square represents 0.1 mv in height (amplitude) and 0.02 seconds in width (duration) at a paper speed of 50 mm/sec. • The calibration signal can be changed, if necessary, to affect amplitude only.
Calculating Heart Rate • Use a ruler to determine set length of tracing. • Determine how many seconds are represented in that tracing. • Count R-R intervals in that set amount of tracing and multiply by the time. • This will give you the heart rate.
Measuring the parts of ECG • P- wave- represents depolarization of the atria, and its duration indicates the time required for an impulse to pass from the SA node to the AV node • The normal P wave on lead II is small, positive and rounded. • It is measured from the upper edge of the baseline to the top of the P wave • The width of the P wave is measured at its inside, from the start to the end of the deflection from the baseline.
P-R interval- reflects the activation of the AV junction. • Measured from the beginning of the P wave to the beginning of the Q wave (R wave, if not Q wave is present)
QRS complex- represents depolarization of the ventricles • The width of QRS complex is measured from the beginning of the first deflection to the end of the final deflection of the complex • The height of the R wave is measured from the top edge of the baseline to the peak of the R-wave • The depth of the Q or S wave is measured from the bottom edge of the baseline to the lowest part of the Q or S respecively
S-T segment- represents the time interval from the end of the QRS interval to the onset of the T wave, the early phase of ventricular repolarization • It may be above, at or below the baseline • Only significant elevations or depressions from baseline should be considered abnormal
Q-T interval- the summation of ventricular depolarization and repolarization and represents ventricular systole • Q-T interval is measured from the onset of the Q-wave to the end of the T-wave • The Q-T interval alone in veterinary medicine is not helpful in diagnosis.
Classification of Arrhythmias • Definition • An abnormality in the rate, regularitym, or site of origin of the cardiac impulse • A disturbance in conduction of the impulse such that the normal sequence of activation of the atria and ventricles is altered
Classification of Arrhythmias • Normal sinus impulse formation • Normal sinus rhythm • Sinus arrhythmia • Disturbances of sinus impulse formation • Sinus bradycardia • Sinus tachycardia • Disturbances of supraventricular impulse formation • Atrial premature complexes • Atrial tachycardia • Atrial fibrillation • Atrioventricular junctional premature complexes • Atrioventricular junctional tachycardia
Disturbances of ventricular impulse formation • Ventricular premature complexes • Ventricular tachycardia • Ventricular systole • Ventricular asystole • Ventricular fibrillation • Disturbances of impulse conduction • Sinus arrest or block • Sick sinus syndrome • Atrial standstill • Ventricular pre-excitation • First-degree AV block • Second degree AV block • Third degree AV block • Left bundle branch block • Right bundle branch block
Building Blocks for Arrhthymia Interpretation • Recognize the site of origin of the abnormal beat • Recognize deviations from the normal rate of automaticity for that site. • Site of Origin • Atrial • Positive deflection P waves are present with a constant P-R interval and normal duration QRS complex • Junctional • Negative deflection P waves, or no P waves with a normally conducted short QRS complex • Ventricular • No P waves are evident, QRS complexes are wide and bizarre appearing and may be positive or negative polarity depending on which ventricle is the site of origin.
Rates of automaticity • Too fast (tachycardia) • Too slow (bradycardia) • Too irritable (Premature) • Absent (block)
Interpreting Arrhythmias • Calculate the heart rate • Assess the rhythm • Identify the P waves • Assess QRS shape and duration • Assess relationship between P waves and QRS complexes • Name the arrhythmia
Normal Sinus Rhythm • Normal rhythm of the heart
Sinus Arrhythmia • All criteria of normal rhythm except that the R-R intervals are greater than 10 % • Irregular rhythm originating in the SA node, represented by alternating slowr and more rapid heart rate usually related to respiration.
Sinus Bradycardia • Regular sinus rhythm but heart rate is below normal rate
Sinus Tachycardia • Regular sinus rhythm but heart rate above normal rates • Most common arrhythmia of dogs and cats
Atrial Premature Complexes • Supraventricular impulses originiating from ectopic atrial site other than SA node • Seen in dogs and cats with atrial enlargement (mitral insufficiency, cardiomyopathy)
Atrial Tachycardia • Rapid regular rhythm originating from an atrial site other than the sinus node • May be seen in dogs with severe heart disease and in cats with cardiomyopathy or hyperthyroidism
Atrial Fibrillation • Caused by numerous disorganized atrial impulses frequently bombarding the AV node. • May be seen in atrial enlargment or dilated cardiomyopathy.
Ventricular Premature Complexes • Cardiac impulses initiated within the ventricles instead of the sinus node • Seen in large breed dogs with cardiomyopathy