Download
1 / 52
540 likes | 716 Vues
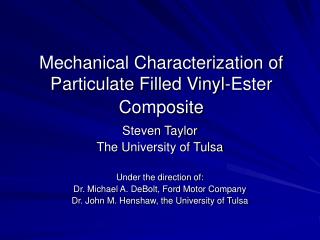
Mechanical Characterization of Particulate Filled Vinyl-Ester Composite. Steven Taylor The University of Tulsa Under the direction of: Dr. Michael A. DeBolt, Ford Motor Company Dr. John M. Henshaw, the University of Tulsa. Overview. Introduction / Background Materials and Molding Process

E N D
Mechanical Characterization of Particulate Filled Vinyl-Ester Composite Steven Taylor The University of Tulsa Under the direction of: Dr. Michael A. DeBolt, Ford Motor Company Dr. John M. Henshaw, the University of Tulsa
Overview • Introduction / Background • Materials and Molding Process • Calcium Carbonate • Hollow Glass Spheres • Polymeric Microspheres • Modeling and Analysis • Theoretical Models • Semi-Empirical Models • Finite Element Analysis • Testing Results • Mechanical Testing • Microstructure and Fracture Surface Analysis • Summary and Conclusions
Introduction • Sheet Molding Compound (SMC) • Used in a variety of applications • Automotive Industry • Structural components • Body Panel • Composite • Base Resin • Filler • Fiber reinforcement • Advantages • Cost effective • Light weight • Formability Lorenz Kunststofftechnik GmbH Applied Composites Corp www.Hostdub.com
Introduction • Fillers • Traditionally Calcium Carbonate (CaCO3) • Inexpensive (ρ = 2.74 g/ cm3) • Lightweight Filler • Hollow Glass Spheres (ρ ≈ 0.3 g/ cm3) • Polymeric Micro spheres (ρ ≈ 0.13 g/ cm3)
Background • Literature search on lightweight filled materials • Models which predict material properties of filled resin systems • Tests and procedures used to qualify new materials • Results and conclusions found in previous work
Background • Specific Properties and Fracture Toughness of Syntactic Foam: Effect of Foam MicrostructuresWouterson, Boey, Hu, Wong • Epicote 1006 epoxy resin system • 3M glass bubbles K 15 and K46 and Phenoset BJO-093 as filler • Mechanical test data were normalized and presented as specific mechanical and fracture properties • An increase in specific tensile strength and decrease in flexural strength with larger volume percents • Plastic deformation of the epoxy and debonding of microspheres
Background • On the Modulus of Three-Component Particulate-Filled CompositesDickie • Polymethyl methacrylate (PMMA) • Glass beads and dispersed rubber as filler • Performed tensile test to determine the modulus of the material • Kerner model was an inappropriate fit for modulus • Modulus may be dependent on size distribution, filler particle deformability and filler to matrix modulus ratios
Background • Elastic Modulus of Two-Phase Materials Hsieh, Tuan • Aluminum oxide containing 0 to 100% volume percentage of nickel aluminide • Compared 12 different theoretical models to experimental results • Reuss and Hashin-Shtrikman lower bond equations gave the best predications of modulus out of 12 models
Problem Statement • Compare lightweight filler to traditional filler in absence of fiber reinforcement • Determine the ‘effective modulus’ of light weight filler • Find effects of incremental amount of filler on material properties such as density, shrinkage, tensile and flexural strength, and thermal expansion • Determine which material models most accurately predict material trends
Introduction & Background Materials & Molding Process Modeling & Analysis TestingResults Summary & Conclusions Materials and Molding Process
Materials and Molding Process • Base Resin • Ashland Arotech Q6055 resin • Luperox DDM-9 catalyst • Westdry Cobalt 6% and Aldrich N, N-Dimethylaniline • Fillers • Calcium Carbonate • Hollow Glass spheres • Polymeric microspheres
8 1 Compressed Air Line • Pressure Pot • Resin Flow Valve • Resin Inlet Tube • Resin Inlet Tube Clamp • Mold Surface • Resin Out / Vacuum Tube • Resin Out Tube Clamp • Mold Heaters 4 6 7 1 9 3 5 2 Materials and Molding Process • Molding Apparatus
Introduction & Background Materials & Molding Process Modeling & Analysis TestingResults Summary & Conclusions Modeling and Analysis
Material Modeling • Modeling to predict material properties • Reduces costly experiments • Allows faster development of new materials • Theoretical and Empirical Models • Rule of Mixtures • Parallel and Series • Reuss Model • Voigt Model • Halphin-Tsai • Hashin-Strikman Bounds • Kerner Model • Paul Model • Differenital Effective Medium Theory • Finite Element Analysis (FEA) • ANSYS and ABAQUS
Material Modeling Results • Paul, Kerner and Hashin-Strikman lower Bounds models most accurately predicts the modulus of plaques containing calcium carbonate • Parallel model best fits density, tensile and flexural UTS, and thermal expansion test data
Material Models • Finite Element Analysis Modeled one-quarter of the cross section of a unit cell. Set the properties of the matrix equal that of the vinyl-ester resin Created a thin walled shell and ‘glued’ the surfaces of the shell to the resin Substituted the hollow glass sphere of the hollow sphere with a solid spherical particle with unknown mechanical properties
Material ModelsFinite Element Results Control Stress Contour Plot Control Strain Contour Plot
Material ModelsFinite Element Results 3M-S22 Axisymmetric Stress Contour Plot 2D Simplified Stress Contour Plot
Material ModelsFinite Element Results 3M-S22 Axisymmetric Strain Contour Plot 2D Simplified Strain Contour Plot
Material ModelsFinite Element Results • Glass Spheres will carry most of the load around the air pocket with “perfect” bond strength. • The resin has the greatest strains at 45° from direction of applied load. • High stress concentration for polymeric microspheres. • Unable to find an ‘effective’ modulus and Poisson's ratio.
Introduction & Background Materials & Molding Process Modeling & Analysis TestingResults Summary & Conclusions Testing Results Percent ShrinkageDensityTensileFlexuralMicrostructure AnalysisFracture Surface Analysis
Percent Shrinkage • Measured test plaques as molded than took additional measurements after post cure • Insignificant changes between as molded and post cured results
▲Neat Vinyl-Ester Resin ♦Calcium Carbonate Percent Shrinkage
▲Neat Vinyl-Ester Resin ♦ Calcium Carbonate ■ 3M-S32 Hollow Glass Spheres Percent Shrinkage
▲Neat Vinyl-Ester Resin ♦ Calcium Carbonate ♦Hollow Polymeric Spheres Percent Shrinkage
Percent Shrinkage • Large amount of scatter • Inaccurate measuring techniques • Decreasing trend in maximum percent shrinkage with increase in volume percent • Insignificant changes between as molded and post cured results
1. Weighing pan of Mettler Toledo balance • 2. Bracket attached to weighing pan • 3. Bracket to pan attachment screws • 4. Beaker Bridge • 5. 250ml Beaker • 6. Sinker and test specimen • 7. Sinker and test specimen holder • 8. Thermometer Density Test Apparatus • Test performed per ASTM 792-00
▲Neat Vinyl-Ester Resin ♦ Calcium Carbonate ♦ Polymeric Microspheres Density
Density Test Results • Small amount of scatter • Parallel model best predicted test results • Linear Increase in density with increase in calcium carbonate • Linear decrease in density with increase in leightweight filler
13 mm 20 mm 3.3 mm 12.7 mm 23 mm 45 mm 80 mm Uni-axial Tensile Test Results • Young’s Modulus • Compared results with theoretical material models. • Ultimate Tensile Stress • Maximum Strain to Failure • Testing performed in accordance with ASTM D638
▲Neat Vinyl-Ester Resin ♦ Calcium Carbonate Paul Parallel Kerner Hashin-Shtrikman Series Tensile Test ResultsYoung’s Modulus
▲Neat Vinyl-Ester Resin ♦ Calcium Carbonate ■ 3M-S32 Hollow Glass Spheres Kerner Paul Parallel Series Hashin-Shtrikman Tensile Test ResultsYoung’s Modulus
▲ Neat Vinyl-Ester Resin ♦ Calcium Carbonate ♦Polymeric Microspheres Kerner Paul Series Parallel Hashin-Shtrikman Tensile Test ResultsYoung’s Modulus
▲ Neat Vinyl-Ester Resin ♦ Calcium Carbonate Tensile Test ResultsUltimate Tensile Strength
▲ Neat Vinyl-Ester Resin ♦ Calcium Carbonate ■ 3M-S32 Hollow Glass Spheres Tensile Test ResultsUltimate Tensile Strength
▲ Neat Vinyl-Ester Resin ♦ Calcium Carbonate ♦Polymeric Microspheres Tensile Test ResultsUltimate Tensile Strength
Tensile Test Results • Paul and Kerner model best predicts the modulus of palques containing calcium carbonate • The ‘effective modulus’ of both the hollow glass and polymeric microspheres is equal to ~3450 Mpa • Ultimate tensile strength is independent of filler type and had a linear decrease with increased filler percentage • Decrease in maximum strain to failure with larger volume percents of filler • Insignificant differences between 4 different series of hollow glass spheres
P TEST SPECIMEN Flexural Test Results • Flexural Modulus • Flexural Strength • Maximum Flexural Strain to Failure • Test performed in accordance to ASTM 6272- 02 • Specimen Size of 80mm X 13mm X 3mm
Coefficient of Thermal Expansion • Coefficient of Linear Thermal Expansion • 30°C to 150°C • Ramp 0.5°C / min • 50.0 mm rod of NIST standard fused silica 739 • Test Specimens 50 mm X 8 mm X 3 mm
Thermal Expansion Test Results • Model hollow glass particulate filler as solid particulate filler with same value for thermal expansion • Parallel model does good job in predicting downward trend of test data
Microstructure Analysis • Conducted microstructure analysis to see distribution of spheres • Used Image-J software to get an approximate value of volume percent filler for samples containing polymeric micropsheres • SEM images to determine failure mode • Fracture surface of 40 percent filler for each material.
Microstructure Analysis20% Filler Hollow Glass Spheres Calcium Carbonate Polymeric Microspheres
Microstructure Analysis50% Filler Hollow Glass Spheres Calcium Carbonate Polymeric Microspheres
Fracture Surface Analysis 40% Filler By VolumeHollow Glass Spheres 40% Filler By VolumePolymeric Microspheres
Fracture Surface Analysis 40% Filler By VolumeHollow Glass Spheres 40% Filler By VolumePolymeric Microspheres
Microstructure Analysis Results • Lack of polymeric microspheres for all volume fractions • Good distribution of calcium carbonate • Hollow glass spheres are grouped together at lower volume fractions • Debonding between filler and matrix • Small amounts of Plastic Yielding in resin
Introduction & Background Materials & Molding Process Modeling & Analysis TestingResults Summary & Conclusions Summary andConclusions
Summary and Conclusions • The elastic modulus of resin containing calcium carbonate is higher than the resin containing lightweight filler of equal volume percentages • The Paul theoretical model does best in fitting both the calcium carbonate and hollow glass and polymeric microspheres data for elastic modulus • Insignificant differences between the 4 different series of 3M spheres for tensile, flexural and thermal expansion test data • The effective modulus of the hollow glass and polymeric microspheres is equal to that of the vinyl ester with a value of ~3450Mpa.
Summary and Conclusions • Adding filler to the vinyl ester creates a decrease in strength of the material, which is independent of filler type. • The strains to failure of the materials filled with calcium carbonate are lower than those filled with the hollow glass and polymeric microspheres with equal filler content. • Scatter in percent shrinkage measurements may be caused by inadequate measuring techniques. • Debonding of the resin from lightweight fillers and breakage of the spheres was observed in the failed samples.
Recommendations • Further investigation should be performed to explain the large amount of scatter in the percent shrinkage of plaques containing no filler. • Further testing should be performed to fully explain the lower than expected percentage of polymeric microspheres in molded plaques for all volume fractions. • Sizing effects should be investigated to create a greater bond strength between filler and resin to increase the ultimate tensile strength of the material. • Expand on finite element models of lightweight to incorporate bond strength, predict compressive effects