Download
1 / 53
540 likes | 738 Vues
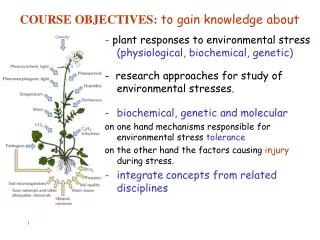
Class Objectives Gain knowledge of scientific methods and theories. Increase understanding and appreciation of ocean and atmosphere. Appreciate historical perspectives of science and its evolution. Learn of similarities and differences of ocean and atmosphere.

E N D
Class Objectives Gain knowledge of scientific methods and theories. Increase understanding and appreciation of ocean and atmosphere. Appreciate historical perspectives of science and its evolution. Learn of similarities and differences of ocean and atmosphere. Obtain skills in reading maps and interpreting data presentations. Develop ability to read and objectively evaluate science articles.
Chemistry Science of matter – its composition, structure, properties, and behavior.Chemical OceanographyInvolves physics, biology, and geology of the world ocean. Interdisciplinary.
Figure 6-4 Classification of matter. Matter is solid material with mass (physics: mass and energy) Mixtures = different types of matter separable by physical means Substances = elements and compounds Elements = atoms (neutrons, protons, electrons) e.g., H, O, Na Compounds = atoms chemically united (like H20 and NaCl) Molecules = two or more atoms united (i.e., H20) where H is hydrogen atom; O is oxygen atom (inorganic & organic) Chem. Physics Physics
Motivation Chemistry affects life in ocean and vice versa.Chemistry is important for climate. Physical properties affected by chemistry (i.e., salinity).Atmosphere is affected by ocean chemistry and vice versa.Pollution is often chemical issue.
HMS Challenger: 1872-1876Provided data concerning composition and structure of ocean. Data are still useful. Why???
What is in Seawater?Seawater is composed of H20 and many dissolved elements and compounds.
Fig. 6-5 Periodic Table of Elements – Major seawater elements (purple) and biologically important elements (in red; i.e., nutrients) are highlighted.
Geometry of a water (H20) molecule. O has 8 protons, 8 neutrons, 8 electrons. H has 1 proton, 1 electron Covalent bonding – Sharing electrons between H and O atoms Note polarity of the H2O molecule
Water has high surface tension (hard to pull molecules apart). Important Properties of Water Molecules Capillary waves: restoring force depends on polar property of H20 molecules and H-bonding. H2O is very good at dissolving materials. Exists as solid, liquid, and gas.
Water is an excellent solvent. Elements like Na readily donate electron while those like Cl readily accept electron. So, Na+ ion and Cl- ion. When together, they form NaCl via ionic bonding.
Figure 6-10 Salt as a solute. Higher temps allow for more solute to be dissolved.
Where does dissolved and particulate material in ocean come from? Hint: Chemistry of ocean involves interactions of land, ocean, and atmosphere and biological organisms. p. 90
How does material enter oceans? • Volcanoes, hot springs, vents (i.e., chloride, Cl) • Weathering rock (i.e., sodium chloride, NaCl) • Rivers • Rain and atmospheric deposition • Meteors from space
Constituents of ocean salinity. Note: NaCl makes up 86% of dissolved elements. Example
Fig. 6-11 Relative proportions of major constituents of dissolved elements in seawater. Dittmar’s Principle. Based on HMS Challenger data. Works for open ocean.
Open Ocean – Dittmar’s Principle applies/Lab exercise uses table. * *Avogadro’s number is number of C atoms in 12 gm of Carbon. Avogadro’s number is 6.023 X10²³ atoms/mol. A mole (mol) is the amount of substance of a system which contains as many elementary entities as there are atoms in 0.012 kilogram (or 12 grams ) of carbon-12.
Approximate Composition of Open Ocean Seawater • Seawater by weight percent: Water 96.5% or 965 ppt Dissolved material 3.5% or 35 ppt Total 100.0% or 1000 ppt ppt = parts per thousand, like percent (%) but using 1000 for reference base instead of 100.
Definition of Salinity • Number of grams of dissolved material in 1 kilogram of seawater • Units in parts per thousand (ppt) or practical salinity units (psu)
Salinity Determination • Given 70 gm of dissolved material in 2 kg or 2000 gm of seawater, what is the salinity? • S = 70 gm/2000gm • = 35 gm/1000gm = 35 gm/1000gm • = 35 ppt or psu
Fig. 6-2 Concept of ocean water column. Properties usually vary with depth. We want to know how many of each molecule type is in the ocean per unit volume and how the concentrations vary with depth.
Dittmar’s Principle • In open ocean, total amount of dissolved materials may change, but ratios of the elements remain very nearly the same (Table 6.1 applies in open ocean) • Thus, we can calculate salinity from chlorinity using formula • S = 1.8 X Cl
Example Calculation • Given Cl = 20 ppt, what is salinity? • S = 1.8 X Cl • = 1.8 X 20 ppt = 36 ppt • Where does this method fail? Rivers, estuaries, bays, near coasts
Measurements of salinity using conductivity • Devices for measurements: CTD: conductivity, temp., depth Salinometer Satellite sensors being developed using microwave energy CTD
Measuring salinity using a CTD. Also collecting water samples. Fig. 6-12 Inc. S gives inc. Cond.
Biologically Important Nutrients for Supporting Phytoplankton (Algae) Phytoplankton (drifting algae) are fundamental to life on Earth Microscopic view of phytoplankton
Fig. 6-13 Biologically important nutrients for phytoplankton: nitrogen, nitrate, silicate, phosphate, ammonia, iron. Phytoplankton
SeaWiFS This map of global chlorophyll concentrations (proxy for phytoplankton) illustrates quite clearly the eutrophic (high in macronutrients) regions of the world ocean, seen in red and green, and the oligotrophic (low in macronutrients) regions, seen in blue and purple.
Fig. 6-14 Colored dissolved material is brownish material in stream entering the Pacific. Why important?
Dittmar’s Principle does not work for rivers, bays, estuaries, and nearshore ocean waters.
Fig. 6-15 Oxygen minimum zones. Why important?
Global Carbon Cycle: Carbon Reservoirs Exchange Rates Residence Times Receding Glacier 1941 2006
Fig. 6-19 Exchange of organic Carbon among various reservoirs. Note sources and sinks of organic Carbon. 2Gtons/yr extra!!! Exchange Rates in Gtons C/yr (Gtons C stored in each reservoir) Note: Gtons = 109 tons
Keeling curve showing increase of atmospheric CO2 at Mauna Loa Observatory – most important curve in science today. Values reached 1500ppm when dinosaurs lived. Some models predict that by end of this century values may reach 560 ppm.
Figure 6a: Water-column integrated anthropogenic CO2 concentrations in the world ocean. Source: NOAA. Where is biggest accumulation of CO2 occurring?
Higher CO2 leads to lower pH. Why is this an issue?
Geological record from ice cores showing time series of atmospheric CO2 Why are there oscillations? See next slide! Why is recent value so high? When did rapid increase begin? Why? How has temperature varied with CO2 concentration? Ice Ages occurred when curve fell below line. Present
Why there are Milankovich cycles: Solar radiation reaching Earth varies due to orbital and Earth orientation changes in time Key scales are: 100,000 years 41,000 years and 23,000 years See Fig. 5-3 and pp. 74-76 in textbook.
Naysayers of Global Warming? Are Gore and OOPC really right? Some argue that 1930’s were warmer than last decade (Physics Today). Temperature sensors in growing urban areas with heat island effects. Artifact, errors biasing temps. CO2 was much greater in past and life survived. Hurricanes are not necessarily getting more frequent and intense. Milankovich orbital effects outweigh greenhouse gas effect And Earth will eventually cool again. CO2 lags temp.? What is so bad about warmer climates? Rates of change? Not all reputable scientists are in agreement – funding/publication issues! Others …..
Aerosol Sampler with IMET on BTM Ed Sholkovitz, WHOI Fe Al Mn P Ca African Dust Event
MITESS Fe Time Series from BTM Ed Boyle, MIT MITESS Fe Time Series
Why the Decrease in Lead? Profiles of lead from 1979-1997 in the Sargasso Sea.
Figure 6-3 Leibig’s Law of the Minimum states that growth of plants is limited by a single element, the one that is available at lowest supply rate. Here N is limiting element. Iron is thought to be often the limiter in open ocean. Iron Hypothesis: Fe as limiting Element Fertilize the Ocean? Why? Controversy