Download
1 / 24
240 likes | 426 Vues
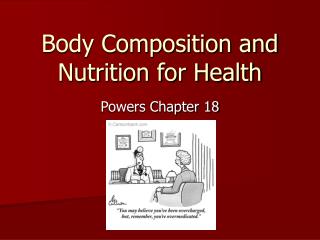
Manifestation of Novel Social Challenges of the European Union in the Teaching Material of Medical Biotechnology Master’s Programmes at the University of Pécs and at the University of Debrecen Identification number: TÁMOP-4.1.2-08/1/A-2009-0011.

E N D
Manifestation of Novel Social Challenges of the European Unionin the Teaching Material ofMedical Biotechnology Master’s Programmesat the University of Pécs and at the University of Debrecen Identification number: TÁMOP-4.1.2-08/1/A-2009-0011
Manifestation of Novel Social Challenges of the European Unionin the Teaching Material ofMedical Biotechnology Master’s Programmesat the University of Pécs and at the University of Debrecen Identification number: TÁMOP-4.1.2-08/1/A-2009-0011 Erika Pétervári and Miklós Székely Molecular and Clinical Basics of Gerontology – Lecture 4 Nutrition,physical status,body composition, sarcopeniapart 2
Consequences What is the consequence of • body weight gain in middle-aged individuals? • the anorexia/cachexia in old populations?
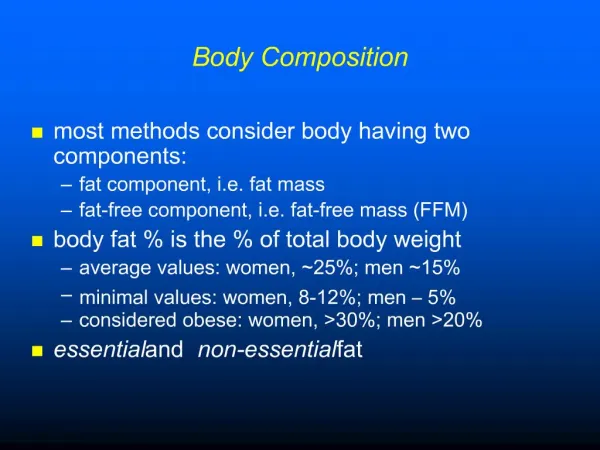
Changes in body compositionwith age The water content of the body changes proportionately with FFM • Water content of the FFM is stable. • Ratio of intracellular / extracellular volume is unknown. • Bone minerals change proportionately with FFM • By 65 it decreases by 10 – 15 %. • Infemales the rate of decrease is enhanced after menopause. This dramatic fall can be prevented by estrogen supplementation. • In active athletes the rate of decrease is similar, but the peak bone mass is higher. • 4 months chronic bedrest – 1.4% deficit, not regained even after 6 months.
Changes in body compositionwith age Muscle mass and strength diminishes slowly until 50, then the rate is enhanced – SARCOPENIA • Between 30 and 80 there is a 30-40 % decrease (also in athletes). • Especially the quick, dynamic contractions are impaired. • The number of motoneurons/motor units fall. • The production of muscle proteins decreases (especially that of type II fibers) • Muscle hypertrophy may be elicited by intensive training even in the elderly (12 weeks – 3 times a week – +10%)
Fat, fat-free mass and cell mass ofmales and females at various ages Fat , fat-free mass, and cell massofmales () and females ()at various ages, values are given, and the number of subjects in each age group is noted. 60 58 33 27 37 42 50 18 40 44 33 89 72 Absolute weight (kg) 54 13 30 20 10 18–25 25–35 35–45 45–55 55–65 65–85 Age (years)
Partial/incomplete starvation Composition of loss in BMI & MR • Adipose tissue 95% • Liver 50% • Skeletal muscles 30% • Bones 8% • Brain 3% • BMR 30% • Starvation (aging anorexia) protein breakdown
Decay of Nature Decay of Nature, or Senile Marasmus, has the greatest number of deaths attributed to it. Their ages vary from 69 to 92 years. The inmates affected with this gradual wasting of body, which approaches very slowly, have usually their mental faculties clear and unclouded till the last, but complain of loss of appetite, bowels costive, pulse small, quick and weak, and sleepless nights, feel no pain, and look on death with seeming indifference and carelessness, in many cases as a happy release. With regards to treatment, medicines are of little use. (H. S. Purdon, 1868)
Anorexia (leads to sarcopenia) • frailty • functional disorders • cognitive disorders • decubitus (bed-sore, pressure ulcer) • hip fractures • quality of life • mortality
Pathogenesis and functional vs. metabolic consequences of sarcopenia Malnutrition Increased oxidative stress Low testosterone, estrogen, GH, IGF-1 Decreased physical activity Cytokines Decreased food intake SARCOPENIA Decreased walking speed Impaired balance Osteoporosis Falls Decreased BMR Impaired thermoregulation Decreased physical activity Impaired ADLS GH = growth hormone; IGF-1 = insulin-like growth factor-1; BMR = basal metabolic rate; ADLS = activities of daily living
The spectrum of caloric intake from insufficient to excessive calories Longevity Cancer Autoimmune disease Oxidative stress Positive effects Regulated diet ↑ Calories Negative effects Hypothetical U-shaped curve over the spectrum of caloric intake from insufficient to excessive calories, emphasizing negative physiologic effects at both extremes and positive or hormetic effects within a range of normal (regulated) caloric intake. Energy deficit Energy excess Parenchymal cell number Loss of function Starvation Death Longevity Cancer Autoimmune disease Oxidative stress
Mechanisms Main mechanisms which lead to • weight gain of middle-aged groups • anorexia of the old
Dysorexia in the elderly: insufficient adaptation to overfeeding Younger Men Older Men 140 3 * 130 * 2 120 110 Body Weight Change During and After Overfeeding (kg) 1 Energy Intake(% of Weight-Maintenance Value) 100 90 0 80 –1 70 20 29 41 77 Lowest Weight Study Day 60 1 2 3 4 5 6 7 8 9 10 Phase 2 Overfeeding Phase 3 Ad Libitum Time After Overfeeding (d) Regulatory disorder!
Dysorexia in the elderly: insufficient adaptation to underfeeding Younger Men Older Men 140 2 * * 130 * 1 120 0 110 Body Weight Change During and After Underfeeding (kg) Energy Intake(% of Weight-Maintenance Value) 100 –1 90 –2 80 –3 70 20 29 41 77 Highest Weight Study Day 60 1 2 3 4 5 6 7 8 9 10 Phase 2 Underfeeding Phase 3 Ad Libitum Time After Underfeeding (d) Regulatory disorder!
Components of energy balance FI MR HL Feedingstate Tc FI = food intake MR = metabolic rate HL = heat loss Tc = core temperature Nutritional state Body weight
Metabolic rate (MR) • BMR, RMR, energy expenditure decrease with age (especially in men). • Possible causes: • FI ( specific dynamic activity of nutrients, thermic effect of food, diet-induced thermogenesis as well) • T3-level • sensitivity to norepinephrine • muscle mass and muscle strength • activity of Na-K-ATP-ase
Food intake (FI):frequent causes of undernutrition in the elderly • Social factors • poverty • problems with independent shopping, cooking etc. • social isolation (lack of partners, table setting ) • Psychological factors • deprivation, sorrow, anxiety, mourning • dementia • depression • Physical factors • immobilization • need for assistance at feeding (e.g. difficulties in slicing the food) • problems of dental health and oral hygiene • problems of dental prosthesis
Frequent causes of undernutrition in the elderly:pathological conditions • Effort to eat (e.g. COPD, congestive heart failure) • Food intake associated pain (e.g. abdominal ischemia) • Recurrent infections, tumors (e.g. TNF) • Ectopic hormon production (e.g.bombesin) • GI disorders (e.g. meteorism, malabsorption, circulatory disorders) • Endogenous toxicosis (e.g. uremia) • Endocrine disorders (e.g. Sheehan syndrome, Addison’s disease) • Medication (e.g.digoxin, theophyllin) or its withdrawal • Neuropsychiatric disorders (e.g. stroke, aging anorexia nervosa)
Real age-related anorexia“aging anorexia” • 1Decreased requirement • low MR • low activity • 2Decreased hedonic value • taste • smell • vision • 3Depressed “feeding drive” • neurotransmitters (e.g. opioids, amines, peptides) • nutritional factors (eg. Zn, nutrients, metabolites) • 4Enhanced satiety factors • cholecystokinin (CCK)
Basal metabolic rate (BMR) and mean daily caloric intake by age groups While BMR fell by less than 20%, kcal intake fell by about 35% between 20 and 70 years. Chronic disease MR rapid progression.
Regulation of FI and MR • Short-term regulation • 1 Nutrients • 2 Metabolites • 3 Gastrointestinal hormones • 4 Neural signals • Long-term regulation • 1 Insulin • 2 Leptin
Hypothalamic regulation of FI Activates NPYrelease NPY/AgRPneuron Orexigenicpathway Ghrelin AgRPrelease Inhibititon of melanocortin pathways Inhibits POMCneuron Anorexigenicpathway MC4receptors MSHrelease Leptin Activates Arcuate nucleus Paraventicular nucleus
Age-related changesin the regulation • In the middle-aged • orexia, body weight (FM) increases • CCK effects , leptin/insulin effect ,NPY, POMC • In the old • anorexia, relative starvation, protein-calorie-malnutrition, muscle mass • CCK-effects , leptin/insulin effects ,NPY , POMC effect
Age-related changesin the regulation • The central hypothalamic regulation of food intake and metabolic rate depends on the dynamic balance between anabolic and catabolic mediator systems. • Age-related changes in the central regulation may contribute to the development of obesity in middle-aged and sarcopenia/cachexia of aging.