Chapter 2: Motion in one dimension
370 likes | 517 Vues
Chapter 2: Motion in one dimension. Variables. Time is shown as a little t . “ t ” is measured in seconds, usually. Sometimes minutes or hours SI unit = seconds (s) Distance is shown as a little y or a little x . “ y ” or “ x ” both mean the same thing.

Chapter 2: Motion in one dimension
E N D
Presentation Transcript
Variables • Time is shown as a little t. • “t” is measured in seconds, usually. • Sometimes minutes or hours • SI unit = seconds (s) • Distance is shown as a little y or a little x. • “y” or “x” both mean the same thing. • “x” is for horizontal; “y” is for vertical • Usually measured in meters • Sometimes kilometers, miles, feet, or inches • SI unit = meters (m) • Velocity & speed are shown as little v. • SI unit for “v” is meter/second (m/s) • Sometimes mph, km/hr, ft/s
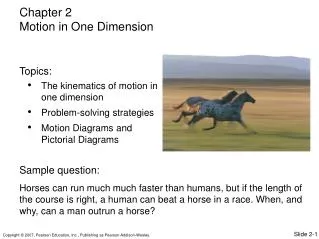
What is Motion? • Motion is changing position along a certain path. • In the first part of physics, we have 2 goals: • To understand howthings move (kinematics) • To understand why things move (dynamics) • “in one dimension” = horizontal OR vertical
Frame of Reference • A reference point is a starting point… a place that everyone calls zero. • When everyone knows where 0 is, then it is much easier to describe the location or position of objects. • Example: In races, the starting line is 0, or your reference point. Everything is measured from the starting line.
Position, Distance, Displacement • Position= Where something is located (with respect to a reference point) • If the object moves… • Distance= scalar quantity • How far the object travels • Magnitude only • Displacement= vector quantity • Magnitude AND direction • Where the object stopped – where the object started OR • Final position – Initial position Δx = xf - xi
Distance vs. Displacement • Distanceis the total path an object travels. • Measures how far an object moves along a path. • Displacementis the line from the beginning to the end. • Measures how far between the starting point and ending point. End Start
Distance vs. Displacement • You start at your house (0). You go to the store. Then you go to your friend’s house. • What is the distance that you travel? • 8 houses • What is your displacement from the beginning to the end? • 2 houses store 0 friend 8
X t V = ------- Speed When an object is “in motion,” its position changes in time. • Speed describes how fast an object is moving. (scalar) • Speed = distance time Units for speed include: miles/hour (MPH), meters/second (m/s), feet/minute (ft/min), kilometers/hour (kph), etc.. INSTANTANEOUS SPEED – speed at a given moment (or instant) in time AVERAGE SPEED – Calculated speed for an entire trip
X t V = ------- Speed • Example: It takes me roughly 35 minutes to get to school, which is 25 miles away from my house. What’s my average speed? V = x / t = 25mi / 35min = 25mi / 0.58hr = 43mi/hr
Speed vs. Velocity • Velocity is an object’s speed in a particular direction. • Answers how fast and which way! • Velocity is a vector quantity • Average velocity = displacement time interval • Usually the time interval starts at 0. • The time interval is always positive.
Note: NOTE: Average velocity is based on the start and finish and is not focused on what happens in the middle. NOTE: Average velocity is the typical value that we calculate when working on problems. How do you know when to use speed and when to use velocity? In this class, speed and velocity are essentially interchangeable. In most cases, either term will work fine, after we learn the difference.
Speed vs. Velocity • You start at your house (0). You go to the store. Then you go to your friend’s house. It takes 10 minutes total. • What is your average speed? • 8 houses/10 minutes = 0.8 houses/min • What is your average velocity from the beginning to the end? • 2 houses/10 minutes = 0.2 houses/min store 0 friend
FUNDAMENTALS OF MOTION TYPES OF VELOCITY INSTANTANEOUS VELOCITY – velocity at a given moment (or instant) in time AVERAGE VELOCITY – calculated velocity for an entire trip CONSTANT VELOCITY – describes an object that is moving at the same speed and in the same direction (cruise control) CHANGING VELOCITY – describes a moving object where one of the following occurs: 1) the speed changes 2) the direction changes 3) both change
Q: What are the main similarities between distance and displacement? • A: Similarities include: • The same general equation • The same units • Both deal with the idea of length Q: What are the main differences between distance and displacement? A: The main differences are the: • Direction • Displacement cares only about beginning and end, while distance cares about the path.
Q: What are the main similarities between speed and velocity? • A: Similarities may include: • The same general equation • The same units • Both deal with the idea of rate and the relationship between distance and time Q: What is the main difference between speed and velocity? A: DIRECTION! Remember: The time interval is always POSITIVE. If you ever get a negative time, you have done something incorrectly.
Distance (m) X t V = ------- Time (s) Graphing Motion • To investigate the relationship between distance or displacement and time, you can use • Mathematical equations or • Graphs of distance vs. time
Here is an example of a position vs. time graph. • What can it tell us? • Where the object was at any time. • How long it took the object to travel a certain distance. • The velocity of the object. = SLOPE of the line
What else does this graph tell us? • It tells us • Starting position of each object • Ending position of each object • Speed and direction of each object • Which object is going fastest • What is B’s speed? 1.33m/s • Who is going faster, A or B?A • How could we tell that without doing the math? because the line of B is not as steep as A’s line A C B
What does a flat horizontal line mean? • Time • Increasing • Distance • Staying the same • Speed • None. The object is not moving Distance (m) Time (s)
25 Position (mi) 35 Time (min) What happens when speed is not constant? 25 • This graph shows a constant slope • constant velocity • Am I traveling 43mi/hr on my entire trip to SKHS? • No. I did not travel at constant velocity, but, 43mph is an average velocity for 35 minutes. Instead of 35 minutes, I can look at • Every 10 minutes • Every 5 minutes • Every minute • Every second… (taking the limit) Position (mi) 35 Time (min)
EXAMPLE: Interpreting Position vs. Time • What distance did the object travel in 5 seconds? • What is the object’s displacement after 5 seconds? • What was the object’s average speed? • What was the object’s average velocity? • Can we tell anything else? • Make up a scenario about this object’s adventures in 5 seconds. 24
Velocity vs. Time Velocity (m/s) Time (s) Velocity vs. Time Graph 2 -2 1 2 Slope A: 4.5m/s B: 6.75m/s C: 2.25m/s D: -2.25m/s E: -6.75m/s
Example: • What does this graph tell us? • What could be happening? • What would the corresponding position vs. time graph look like? • Since the slope of position vs. time tells us velocity, what does the slope of a velocity vs. time graph tell us?
FUNDAMENTALS OF MOTION ACCELERATION – rate at which velocity is changing SI unit = meters/second/second (m/s2). The English unit is feet/second/second (ft/s2) NOTE: Acceleration is a vector quantity and must have direction. The word “acceleration” generally indicates an increase in velocity. The word “deceleration” generally indicates a decrease in velocity. INSTANTANEOUS ACCELERATION – acceleration at a given moment (or instant) in time AVERAGE ACCELERATION – calculated acceleration for an entire trip
Equations To calculate the average acceleration, you must divide the change in velocity by the total time: NOTE: Average acceleration is based on the starting and ending velocity is not focused on what happens in the middle. NOTE: Sometimes there is a bar above a variable that is occasionally used to denote “average.” NOTE: In this class we will only use average acceleration… we will keep our accelerations constant!
Example You’re riding a motorcycle at 25 m/s and come to a uniform stop at a red light in 5 seconds. What’s your acceleration? Looking for: acceleration (a) Given: 25 m/s = vi 5 s = t Stop = 0 = vf
x Graphing w/o Acceleration C B t A D A … Start from rest south of home; head north B … Pass home; stop (still moving north) C … Turn around; head south D … Continue heading south; stop near the starting point This doesn’t really happen… We are always changing our speed and direction.
x Graphing w/ Acceleration C B t A D A … Start from rest south of home; increase speed gradually B … Pass home; gradually slow to a stop (still moving north) C … Turn around; gradually speed back up again heading south D … Continue heading south; gradually slow to a stop near the starting point
x Tangent Lines t On a position vs. time graph:
x t Concavity On a position vs. time graph: Concave up means positive acceleration. Concave down means negative acceleration.
x t Special Points Q R P S
x t Curve Summary B C A D
x t All 3 Graphs v t a t
Why the purple dotted lines? • From a position vs. time to a velocity vs. time: • Line up the graphs vertically. • Draw vertical dashed lines at special points except intercepts. • Map the slopes of the position graph onto the velocity graph. • A red peak or valley means a blue time intercept. • The same rules apply in making an acceleration graph from a velocity graph. Just graph the slopes! • Note: a positive constant slope in blue means a positive constant green segment. The steeper the blue slope, the farther the green segment is from the time axis. Everything along the purple dotted lines happens at the same time!
Graph Practice Try making all three graphs for the following scenario: 1.Joe starts out north of home. At time zero he’s driving a cement mixer south very fast at a constant speed. 2. He accidentally runs over an innocent moose crossing the road, so he slows to a stop to check on the poor moose. 3. He pauses for a while until he determines the moose is squashed flat and deader than a doornail. 4. Fleeing the scene of the crime, Joe takes off again in the same direction, speeding up quickly. 5. When his conscience gets the better of him, he slows, turns around, and returns to the crash site.
RECAP Displacement →Δx = xf – xi Velocity → v = Acceleration → a = When talking about horizontal motion, it is usually in a straight line, so displacement = distance. Δx Δt Δv Δt