Download
1 / 19
190 likes | 331 Vues
Stream Computing, through its innovative System S platform, revolutionizes data analytics by managing high ingestion volumes of structured and unstructured data. It offers a robust framework for continuous processing across diverse data sources, including audio, video, and financial transactions, while ensuring security and privacy. With capabilities for adaptable resource allocation and real-time data visualization, System S serves research, pilot projects, and operational infrastructure with a focus on scalability and efficiency in heterogeneous environments.

E N D
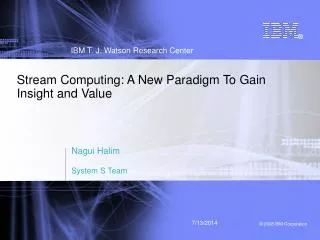
Stream Computing: A New Paradigm To Gain Insight and Value Nagui Halim System S Team
News/weather Text,data feeds Market feeds
System S is a high performance computing platform designed to host a new class of stream analytic applications Designed for high ingest volumes and to adapt to changing data, needs, and capability System S is an operational prototype, with a stable core that serves as the base for pilots and for systems and stream computing research
Component Repository System S Functional Overview Workflow Development Tooling Data Source Management IDE Component Generation Workflow Assembly High performance scalability infrastructure Job Manager Scheduler Result Data Delivery / Visualization High Volume, Structured & Unstructured Streaming Data Sources Output Connectors Input Connectors continuous processing of streaming data Image Audio, voice, VoIP Video, TV, financial news Radio, police scanners Web traffic, email, chat, GPS data Financial transaction data, Satellite data Sensors, badge swipes, … Secure, Privacy Preserving Using Certified Downgraders Heterogeneous, Multi-scale and/or Commodity Hardware
Correlate Transform Annotator Filter Classifier System S Analytic Processing Building BlocksClassifiers, Annotators, Correlators, Filters, Aggregators
Transport System S Data Fabric X86 Box X86 Blade FPGA Blade X86 Blade Cell Blade X86 Blade X86 Blade X86 Blade X86 Blade X86 Blade Optimizing scheduler assigns operators to processing nodes, and continually manages resource allocation System S Runtime Services Runs on commodity hardware – from single node to blade centers to high performance multi-rack clusters Processing Element Container Processing Element Container Processing Element Container Processing Element Container Processing Element Container
Transport System S Data Fabric X86 Box X86 Blade FPGA Blade Blue Gene Cell Blade X86 Blade X86 Blade X86 Blade X86 Blade X86 Blade Optimizing scheduler assigns operators to processing nodes, and continually manages resource allocation System S Runtime Services Adapts to changes in resources, workload, data rates Runs on commodity hardware – from single node to blade centers to high performance multi-rack clusters Processing Element Container Processing Element Container Processing Element Container Processing Element Container Processing Element Container Capable of exploiting specialized hardware
Overview, Beacon Institute for Rivers and Estuaries • Nonprofit organization, based in Beacon, NY • Patterned after Woods Hole Oceanographic Institute • Formed 2000 by Gov. Pataki • Mission: “To create a global center for interdisciplinary research, policy-making and education regarding rivers, estuaries and their connection with society.” • $30M capital, additional $12M this year + program funds • 90% NY State funding • Balance NSF and private donors
Center for Advanced Environmental Technology (40,000 ft2 ) Troy • Office • Research Beacon • HQ • Harbor (pier for research vessel) • Multi-use building • Research Center Palisades • Columbia’s Lamont Doherty Earth Observatory Manhattan • Research pier Evolution/locations
Autonomous Microbial Genosensor Core: An advanced sensor-based environment • Open and scalable network • Bearer network agnostic • Heterogeneous • Physical • Chemical • Biological • Radiological • Multiple deployment platforms • Fixed • Mobile • End-to-end middleware • Device management • Security • Conductivity • Temperature • Turbidity • pH/ORP • Chlorophyll Sontek-YSI Array Solar-powered Autonomous Underwater Vehicle
FSS Industry Point of View Sources: IBM Institute for Business Value “FM2015 – The Trader is Dead, Long Live the Trader”; IBM / EIU Macro Model, 2007; SIAC, OPRA, and NASDAQ courtesy the TABB Group • The financial markets industry is growing quickly while experiencing rapid electronification and automation. • Speed and transparency will increase dramatically. • To survive firms will specialize, and compete based on technology.
Deposit Metal (Cu) in structure Photoresist and Etch to create structures Use Chemical and Mechanical Polishing to planarize surface M1 Rs Processing Pipeline: Wafer Processing SiCOH1,1 Anneal1 CMP1,1 Raw Wafer Processed Wafer CMP1,2 SiCOH1,2 Anneal2 SiCOH6,6 Anneal4 CMP13,2
Statistical Process Control (SPC) Identify tool/product drift and automatically shut down recipe/tool Fault Detection and Classification (FDC) Multivariate monitoring for real-time process fault detection and classification Advanced Process Control (APC) Feedback and feed forward controls to compensate for variations in incoming material and prior level processing Other Data Event, sensor, alarm, tool log, control job, process job Data Warehouse m1 Rs Processing Pipeline: Instrumentation SiCOH1,1 Anneal1 CMP1,1 Raw Wafer Processed Wafer CMP1,2 SiCOH1,2 Anneal2 SiCOH6,6 Anneal4 CMP13,2 Trace Data FDC Summary Statistics Pad Hrs Dresser Hrs Slurry Compos. Process Data Data Availability Time Oxide Thickness Refractive Index Anneal Duration Defect Data m1 Rs value Yield Test Data
Sensitivity varies across FDC values 90% prediction accuracy Prediction accuracy with tool based operating thresholds ~10% Two-Class Decision Tree Y N Built Decision Tree Good-Exc Bad-OK Good-Exc Bad-OK Good-Exc Bad-OK Bad-OK Good-Exc Bad-OK Confusion Matrix
FA EMR Data Plug-in Other Plug-ins AR External Data Access Manager EP PT QRS RR SPA SP Analysis Jobs AP BPA BP Sensor Data Sensor Data Sensor Data I8 O23 I9 SDO2SE O11 alert I21 SDO2SE O13 SDO2SE I10 O25 O24 O30 I45 I41 Angina Pectoris I2 O42 O40 I52 I50 I49 I56 alert WTA O51 WT O70 O71 I79 I80 I83 I89 Well-Being WB I96 I97 O95 O33 O45 alert I15 I67 Administrator Portal Interoperability Container (HIE Adapter) JDL from IDE Century CENTURYServer Client Application Registration Service Patient Registration Service Provenance Server Provenizer Application Info Patient Info h Registration Systen Analysis Framework PE Repository TVC Rule Enrollment Trigger TVC Accessor Process Provenance Query Manager Dynamic Provenance Storage Manager Dynamic Provenance Reg SPE Event Delivery Data Provenance Query Manager Data Provenance Manager Event Preprocessor Sink PE Stream Element Device Agent Source PE Sink PE Filter APP Stream Element Engine DB Agent Source PE Device Adapter DeMux Filter GUI APP Sink PE SODA DB Agent Filter Delivery System GUI Source PE DB Agent DB Agent Provenance Query Service Provenance Cache System S SPC APP Subscription Service Subscription Data GUI QoI Management Event Management Service Remote Access Manager Event Storage Manager Event Store QoI Data QoI Manager APP Event Store Query Service GUI WAS
Geospatial tracking Battlespace command & control Multisource monitoring Call center monitoring (cross sale) Card fraud detection & prevention Capital market surveillance Early warning system for energy trading Lease management system Clickstream analysis Health monitoring Real-time game monitoring Database monitoring Salesforce enablement Retail inventory optimization Astrophysical data mining Fraud detection & prevention Cross-sales Sensor based water mgtt Risk analytics platform Trade desk monitoring Artwork safety Risk management in energy trading Baggage handling Location based services Industrial process control Health records screening Call center monitoring (quality) Telco QoS & SLA monitoring Telecom billing Telecom network security Asset tracking Online hotel booking Retail goods receipt Automated trading Liquidity management system Manufacturing process control Shop floor monitoring Real-time information delivery Solution positioning based on processing needs ( indicative positioning) s Decision latency ms m h Human decisions Automated decisions Analytics complexity (event correlation and pattern matching) Predictive processing (pattern matching and inferencing) Segment 1: exception detection Segment 2: operational monitoring Segment 3: high performance processing Segment 4: adaptive BPM Event complexity (diversity) structured unstructured
Vision • Stream Computing is a new computing paradigm that opens up entirely new ways of conducting science and business • System S is a prototype platform that enables new insights to be gained from large volumes of complex data with sophisticated on the fly analysis • The new insights can drive value to organizations by giving them more accurate answers more quickly • System S is one element of an overall solution framework that will include other elements such as databases, messaging, and modeling • The quantities and types of data that organizations can take advantage of will increase by orders of magnitude over time; new computational paradigms are necessary to drive new value from this information