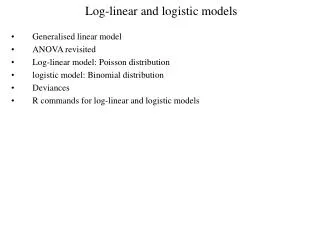
Log-linear Models for Two-Factor ANOVA
Dive deep into log-linear models for 2-dimensional tables, exploring interactions and main effects in statistical analysis. Learn about odds ratios, conditional probabilities, and the loglin command for effective data interpretation.

Log-linear Models for Two-Factor ANOVA
E N D
Presentation Transcript
Log-linear Models For 2-dimensional tables
Main effects are deviations of marginal means from the grand mean. • Interaction represents how the profile of means for one variable depends on the level of the other variable – departure from an additive model. Main effects add to zero and interactions add to zero
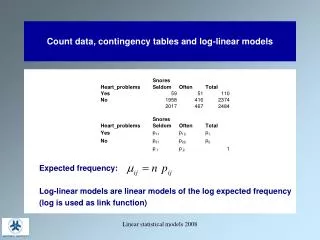
For a table with I rows and J columns Compare Variable Level
Linear Model for the Log Expected Frequency Main effects are deviations of marginal mean log expected frequency from the grand mean of the log expected frequencies.
Interaction terms Represent Relationship between Variables • Interaction means the pattern of probabilities for one variable depends on the value of the other variable. This means they are related. • See how it works for a 2x2 table • Start with the cross-product ratio alpha (not the same as the significance level, and not a main effect).
Representing the probability of an event by p (Could be conditional) • If p=1/2, odds = .5/(1-.5) = 1 (to 1) • If p=2/3, odds = 2 (to 1) • If p=3/5, odds = (3/5)/(2/5) = 1.5 (to 1) • If p=1/5, odds = .25 (to 1)
Odds Ratio • Conditional odds of being in Col One given in Row One • Conditional odds of being in Col One given in Row Two = p21/p22 • Ratio of these two quantities is
The (estimated) odds of being accepted are times as great in Department A, compared to Department F.
Some things to notice • The cross-product (odds) ratio is meaningful for large tables; apply it to 2x2 sub-tables. • Re-arrange rows and columns as desired to get the cell you want in the upper left position. • Combining rows or columns (especially columns) by adding the frequencies is natural and valid. • If you hear something like “Chances of death before age 50 are four times as great for smokers,” most likely they are talking about an odds ratio.
No relationship means parallel slopes in the log scale Also applies to expected frequencies
A General Rule • For any 2-dimensional table, maximum likelihood under the null hypothesis of independence yields the same estimated expected frequencies used by the Pearson chisquare test. • So you can always use • And calculate either test statistic with df = (I-1)(J-1) • Trust Pearson statistic more for smaller samples.