Download
1 / 44
440 likes | 1.08k Vues
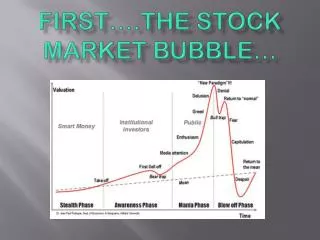
Understanding the Late 1990s Large-Cap Stock Market Bubble . David L. Debertin Professor of Agricultural Economics University of Kentucky DLDebertin@aol.com. Foreword.

E N D
Understanding the Late 1990s Large-CapStock Market Bubble David L. Debertin Professor of Agricultural Economics University of Kentucky DLDebertin@aol.com
Foreword This slide show is designed to help better understand the conditions that led to the bubble in large-cap stock prices in the late 1990s, and what happened as and after the bubble burst…
The following graph provides a comparison of two actively-managed mutual funds that are representative of the performance of actively managed funds that can be characterized as Large-Cap Growth versus Small and Mid-Cap Value for a 15-year period beginning in 1990. The Large-Cap Growth fund is Fidelity Growth Company (FDGRX) and the Small and Mid-Cap Value fund is Fidelity Low-Priced (FLPSX). Share prices for both have been normalized to $1 a share for both funds at the start of the period.
Note that in the mid 1990s, FDGRX starts to increase much more rapidly than FLPSX, and there are instances in 1998 and 1999 where FLPSX is nearly flat. During these periods, investors are underinvesting in small and mid-cap value stocks to take advantage of the boom in large cap growth stocks
In March of 2000, The NASDAQ and FDGRX peaked, followed by a steep sell off. Notice that FLPSX continued to rise throughout this period as investors began to rotate some of the proceeds from the sale of Large-Cap Growth stocks into purchases of Small- and Mid-Cap Value stocks. There was a secondary large cap growth peak in August of 2000, but after that large cap growth stock prices deteriorated rapidly. However, some of the proceeds from the sale of large-cap growth stocks continued to be reinvested in small- and mid-cap value stocks, and FLPSX continued to rise through most of the period. Even in the steep overall market sell off of 2002 (22% loss in the S&P 500), FLPSX lost very little (about 6 %). Large-cap funds focusing primarily on stocks with above market average P/E ratios fared even worse than the S&P 500, with FDGRX Being off over 33 percent that year. This performance is typical of Large-Cap Growth funds with portfolios containing a lot of above market average P/E stocks in 2002.
Consider the period from 1995 through 1999, when even the S&P 500 was going up at 20 % per year, and funds with larger NASDAQ 100 exposure were going up even faster. Given the market capitalization represented by these large companies, it took huge amounts of new injections of cash each year during the period to sustain these annual percentage gains. In retrospect, it’s surprising that a large cap rally of this magnitude was sustainable for as long as it was. At some point investors run out of new cash to invest.
In contrast, a 20% + rally in small and mid-cap value stocks is much easier to sustain because the the total market cap of the entire group of stocks is much smaller. Far smaller annual cash inflows are needed to sustain 20% annual appreciation rate in Small- and Mid-Cap Value than in Large-Cap Growth. To the extent that lots of cash flows into funds holding primarily small and mid-cap value stocks, the major problem fund managers face is identifying stocks that are cheap on a P/E basis yet represent favorable opportunities for further gains.
So we see lots of small and mid –cap value funds closing to new investors (FLPSX, RYLPX) as soon as these inflows start to get unmanageable. A fund manager for a large-cap growth fund facing inflows will not likely run into the same problem to near the same degree. Fortunately for investors with new money to invest, there are now index funds concentrating on small and mid cap value (i.e. VISVX) as well as Exchange Traded Funds (ETF’s) that allow investors to purchase S&P/Barra and Russell Value indices directly. Still, the underlying value stocks need to be able to absorb the cash inflows without too much increase in the P/E’s .
Since early 2000, we have yet to have a sustained rally in large-cap growth stocks, although investors in small and mid-cap value stocks (and funds with investment objectives similar to FLPSX) have continued to fare well through most of the period. We have had some short periods of 1-3 months in outperformance of Large-Cap Growth over Small-and Mid-Cap Value but not longer time periods. This suggests that having gotten burned by holding large cap growth stocks after April 2000, investors are very wary of investing in large-cap stocks that do not appear to offer good value. Investors in 2004 appear to have shown increasing interest in large-cap value stocks as the year progressed, however (GARP).
In the following diagrams, assume that the large green circle represents the total market capitalization of all large-cap growth stocks, and the red circle represents the total market capitalization of the universe of small- and mid-cap value stocks at the beginning of the run-up in large cap growth stocks in the mid 1990s. The red circle is much smaller because the total market capitalization of all small- and mid-cap value stocks (those with below- market P/E ratios) is much smaller than for large-cap growth.
Large-Cap Growth Small-and Mid-Cap Value
As we move into 1998 and 1999, Large-Cap Growth Substantially outperformed Small and Mid-Cap Value. Fund managers complained that no one was interested in buying below-market P/E stocks, especially in the small- and mid-cap size range. Funds emphasizing these stocks fared poorly, even relative to the S&P 500 (which was increasingly dominated by small, high market cap technology firms with few employees or earnings, but nosebleed stock prices). Often these were technology or Internet-related firms as investors showed little interest in stocks of firms in sectors thought to be slower growing at any market capitalization level large or small.
This was a period of extreme euphoria in the US. The Cold War had been won, the federal budget was showing an increasing surplus—something that had not happened in ages. Business schools were talking about new theories of stock valuation that no longer relied as much on current earnings, and companies were stressing their pro forma profits that excluded many expense items. Pro forma profits as reported to Wall Street could be nearly whatever the company officers wanted them to be, ignoring costs whenever convenient. Sadly, many accountants went along with this “new accounting math”. Meanwhile you had near startup Internet-based companies with billion dollar market caps, and officers with net worths of 10s and even 100s of millions of dollars based on the price of the stock in a recent public offering.
You had companies like AOL becoming an S&P 500-sized firm based on market capitalization and having enough value to enable it to gobble up older, established but slower-growing traditional media firms such as Time Warner. By early 2000 an increasing number of people including investors started to believe that share prices could not grow to the sky without real (and not just pro forma) earnings, and the bubble burst, first in April of 2000 with a steep sell-off in high-growth, high P/E technology firms, followed by a short rally into August 2000 which was quickly followed by a sharper and still deeper downturn. The air was starting to go out of the large-cap Growth balloon!
Large-Cap Growth Small-and Mid-Cap Value
Whenever investors sell stocks, the proceeds from The sale must be parked somewhere. We know now that in the sell off starting in 2000, many investors wanted to believe that the downturn was very temporary. Therefore they parked large amounts of cash in money market funds and other accounts where their principal would at least be safe. All this cash caused interest rates on money market funds to fall to historically low levels. Option 1: Hold Cash with the idea of moving back into the market soon
Large-Cap Growth Small-and Mid-Cap Value Cash, Money- Market Funds
A second option was to park cash from the proceeds in US Government or high-grade corporate bonds. Investors who did this fared quite well for a period of time, as the Federal Reserve was increasingly worried about the threat of a recession (in part brought on by the puncturing of the Large-Cap balloon), rather than inflation. As interest rates begun their slow decline, bondholders who had gotten out early saw the value of bonds they purchased in 2000 and 2001 appreciate in value. Option 2: Invest in Government Debt or High-Grade Corporate bonds
Large-Cap Growth Small-and Mid-Cap Value Cash, Money- Market Funds Government and Corporate Bonds
A third major option involved rotating proceeds from the sale of Large-Cap Growth stocks and mutual funds into another segment of the market. Here the relative size of the large-cap growth side of the market versus small- and mid-cap value side is important. If only a small portion of proceeds from the sale of large-cap growth stocks get reinvested into small- and mid-cap value stocks and funds, because the total market cap is so much smaller in that segment, that will be enough to fuel a strong up-movement in small- and mid cap stocks and funds containing those stocks. Option 3: Invest in Small-and Mid-Cap Value stocks
Large-Cap Growth Small-and Mid-Cap Value Cash, Money- Market Funds Government and Corporate Bonds
The period of relative outperformance of small- and mid-cap value stocks and funds relative to large cap growth funds continues through 2004, with only brief largely unsustainable rallies on the large-cap growth side. It is important to note that because of the comparative size of the total market capitalization of stocks labeled Large-Cap Growth versus Small- and Mid- Cap Value, it takes far less newly invested cash to sustain this relative overperformance on the Small- and Mid-Cap Value side of the market. In short, the outperformance of Small and Mid-cap Value relative to Large-Cap Growth could continue for some time to come.
Meanwhile we still have lots of investors with proceeds from stock sales when the large-cap growth bubble burst still earning low rates of interest on money market funds. Life is about to become far more difficult for those holding cash in bonds, as the value of more recently purchased bonds decrease as interest rates begin a slow but steady rise. The bond market quickly becomes a Chinese water torture in which assets are depleted a drop at a time, and investors will increasingly want to find other opportunities for the money invested in bonds as the Fed does its thing with respect to slowly raising rates, and the full impacts of the huge federal deficits start to hit the credit markets.
Over the next several years, barring major terrorist attacks or another major economic downturn, more and more of the money now parked in money market accounts and shorter-term government bonds will likely come back into the equities market in some form. An interesting question is what side of the market will that money tend to favor. Investors still clearly remember what happened to their investments when the balloon burst in 2000, and those that simply held on still are a long ways from having fully recovered. Meanwhile they also observe the recent data showing outperformance of Small- and Mid-Cap Value. Even a small portion of new cash gets invested on this side a rally in these stocks may very well continue.
Because of its size, the large-cap side of the stock market has a far greater capacity to absorb huge cash inflows than does the small and mid-cap side. Further, if we are looking at the universe of small- and mid-cap stocks that can be bought at below market average P/E ratios, unless earnings rise in line with the purchases using net cash inflows, P/E ratios could quickly rise, making the stocks no longer a Value play. Both the indexes and actively-managed funds no doubt have definite sell rules when a once value stock is to be sold or dropped from an index. Otherwise a Value fund would not remain a Value fund for long!
Meanwhile you have the effort toward privatizing a portion of social security. The Social Security Trust fund is running a current surplus in that current collections exceed current payouts. Currently, that surplus is used to finance the national debt in that it is used to purchase government bonds. The federal government could fairly readily privatize a portion of social security by permitting working people to place a share of that current surplus in a privately held account with their own individual names on it—i.e. a vested versus the current non-vested (pay benefits as you go) plan. One option in a vested plan would be for the individual to invest that money in US government bonds. That is what happens to the trust fund surplus right now, except that those bonds are not tied to a particular worker.
But the most interesting possibility would be allowing at least a portion of the privatized dollars to be invested in the equities markets. Even a small portion privatized would represent a huge sum of cash for the equities markets to absorb, and quickly would go beyond the amounts the small-and mid-cap side of the market could absorb. Further, the Federal government at least initially would likely believe that the large-cap equity markets represent less long-term risk than the small- and mid-cap markets, and workers may not have alternatives that go beyond funds dominated by large-cap stocks. So social security privatization might lead to a mini-boom in large-cap stocks and funds as the markets absorb the new cash (cash currently in government debt instruments).
If workers are permitted to move privatized social security accounts into investments other than US Government debt, in essence they will each be selling some of the Government bonds now represented by the current surplus in the Social Security Trust fund. The Government will still have to finance the debt once financed by trust fund surpluses, and in order to do this, interest rates on government debt will likely rise. Meanwhile investments in equities by workers paying into social security should lead to growth in the private sector. Tax revenues from this growth might to a degree offset increased expenditures by the federal government for interest on the national debt.
The Corporation One way of viewing a corporation is that it is simply a mechanism for deploying capital From a capital budgeting perspective, corporations seek to deploy capital in such a way that will permit them to earn above market average internal rates of return Were this not true the investor would do better by simply investing in the market index
Large corporations need large capital projects for them to have any meaningful impact on rates of return and earnings Many large-cap corporations appear to be running out of ideas for deploying capital at high rates of return Microsoft gives investors back a large dividend rather than deploying capital in high payoff projects within the firm AT&T deploys capital in projects earning below average rates of return? GE In the 90s an exception, but now?
Mid- and small-cap firms need to implement smaller projects than large firms do in order to positively affect overall rates of return and earnings Smaller firms have more opportunities to increase Economic Value Added (EVA) Smaller not larger firms have the potential for faster year over year growth rates Projects with high potential payoffs can be riskier than projects with lower payoffs
Larger firms have some advantages: • Less competition • Dominance over markets • Access to capital • Name recognition
Nobel-prize winning economists Harry Markowitz and Robert Sharpe developed the underlying theory that forms the basis for the mutual fund industry. They argued that a properly diversified portfolio of volatile stocks would be substantially less volatile than each individual stock in the portfolio taken alone Their solution to diversification suggested picking individual stocks for a portfolio that all have a good potential for high returns over a long period of time, but combine stocks whose returns patterns often do not move together.
Markowitz and Sharpe would likely have suggested that an investor diversify by putting half the original investment in FLPSX and the other half in FDGRX. The returns would have looked like the red line on the following graph
The Diversified (Markowitz-Sharpe) strategy which puts half the initial investment in each fund (FLPSX and FDGRX) appears to be better than the all-Growth (all FDGRX) strategy but more volatile and risky than the all-Value (all FLPSX) strategy. Losses in 2000-2002 for the Diversified strategy while a bit muted are still substantial, and month to month variation in returns remains high.
The Holy Grail of investing is a model that would tell the investor that relative gains from one fund (or stock) are starting to increase in comparison with another fund or stock, and then also signal when the relative gains are beginning to narrow. Such a model would provide the necessary signals so that the investor could ride up a market bubble such as that which occurred in Large-cap growth stocks and funds, and them move into something else (perhaps a Value fund) just after the bubble begins to burst.
I have developed such a model and that model appears to accurately signal when an investor should be in Large-Cap Growth (FDGRX) versus Small and Mid-Cap Value (FLPSX). Graphing the model results, we get the following graph from a one-time $1,000 investment in April, 1990 to December, 2004 All Growth= $1,000 FDGRX bought and held All Value = $1,000 FLPSX bought and Held Switching = $1,000 invested according to signals from the Debertin spreadsheet Switching Model
The Debertin Switching model generates an ending value about twice as great as the buy-and-hold Value (FLPSX) strategy, and about four times as great as the buy-and-hold Growth strategy $6,135 All Growth= $1,000 FDGRX bought and held $12,055 All Value = $1,000 FLPSX bought and Held $9,095 = Markowitz-Sharpe Diversified ($500 in FLPSX, $500 in FDGRX) $25,359 Switching = $1,000 invested according to signals from the Debertin spreadsheet Switching Model
The Switching model requires only a limited number of rotations between FDGRX and FLPSX over the entire period, and signals when they should occur with a high degree of accuracy Further details about implementing the Debertin Holy Grail Switching model can be found at http://www.dldebertin.com/finance/grail.htm ----David L. Debertin