Download
1 / 15
150 likes | 186 Vues
Section 7.8. Modeling with Quadratic Functions. Example.

E N D
Section 7.8 Modeling with Quadratic Functions
Example Airlines originated frequent-flier programs in 1981. The cumulative unredeemed miles are the total number of frequent-flier miles that members have not redeemed (spent) from 1981 through a specified year (see table). Let c be the cumulative unredeemed miles (in trillions of miles) at t years since 1980. Section 7.8 Slide 2 Using a Quadratic Function to Make Predictions Using Quadratic Functions to Make Predictions
Example Example Continued 1. Find a model to describe the situation. 2. In what years is there model breakdown for certain? 3. Predict the cumulative unredeemed miles in 2010. Predict when the cumulative unredeemed miles will be 25 trillion miles. Use a graphing Calculator to plot a scattergram Solution Section 7.8 Slide 3 Using a Quadratic Function to Make Predictions Using Quadratic Functions to Make Predictions
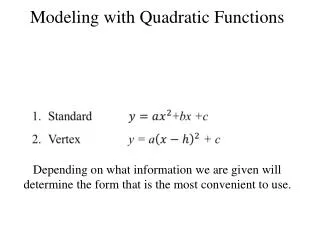
Solution 1. The curve “bend” so not linear Quadratic Model is a better fit is a better model Section 7.8 Slide 4 Using a Quadratic Function to Make Predictions Using Quadratic Functions to Make Predictions
Example Solution Continued 2. Find the vertex: 3. Find miles in 2010, so t = 30 Section 7.8 Slide 5 Using a Quadratic Function to Make Predictions Using Quadratic Functions to Make Predictions
Example Solution Continued 4. Section 7.8 Slide 6 Using a Quadratic Function to Make Predictions Using Quadratic Functions to Make Predictions
Example The Table lists the percentages of workers who use computers on the job by age groups. Let p = f (t) be the percentage of workers who use computers at age t years. 1. Find a formula of a function that provides a reasonable model of the computer data. Section 7.8 Slide 7 Finding the Maximum or Minimum Value of a Quantity Making Estimates
Example Example Continued 2. Use f to estimate the percentage of 22-year-old workers who use computers on the job. 3. Estimate the age(s) at which half of workers use computers on the job. 4. Estimate the age of workers who are most likely to use computers on the job (maximum percentage). What is that maximum percentage? 5. Find the t-intercepts. What do they mean in this situation? Section 7.8 Slide 8 Finding the Maximum or Minimum Value of a Quantity Making Estimates
Solution 1. Use a graphing calculator to find quadratic regression Section 7.8 Slide 9 Finding the Maximum or Minimum Value of a Quantity Making Estimates
Solution Solution Continued About 37.2% of 22-year-old workers use computers at work Half of all workers is 50% Substitute 50 for f (t) Rewrite in ax2 + bx + c = 0 Section 7.8 Slide 10 Finding the Maximum or Minimum Value of a Quantity Making Estimates
Solution Solution Continued 4. t coordinate is about 40 Evaluate f (40) 5. Find t-intercepts Section 7.8 Slide 11 Finding the Maximum or Minimum Value of a Quantity Making Estimates
Solution Solution Continued Verify using a graphing calculator Section 7.8 Slide 12 Finding the Maximum or Minimum Value of a Quantity Making Estimates
Example The numbers of videocassettes and DVDs bought by U.S. dealers to sell as rentals are shown in the table for various years. Estimate when sales of DVDs to dealers overtook sales of videocassettes to dealers. Section 7.8 Slide 13 Modeling with a System of Quadratic Equations Modeling with a System of Quadratic Equations
Solution Videocassette ScattergramDVD Scattergram Section 7.8 Slide 14 Modeling with a System of Quadratic Equations Modeling with a System of Quadratic Equations
Solution Solution Continued Find when they are equal Section 7.8 Slide 15 Modeling with a System of Quadratic Equations Modeling with a System of Quadratic Equations