6th Grade Science Review: Minerals, Rocks, Living Matter, and Speed Concepts
100 likes | 224 Vues
In this week's 6th-grade review, we explore key concepts in mineral classification, rock types, living matter elements, and speed calculations. Students learn to classify minerals by hardness, luster, density, texture, color, and streak, emphasizing the reliability of streak as an identifier. We also examine the rock cycle, detailing sedimentary, metamorphic, and igneous rocks. Additionally, we cover the fundamentals of average speed and graph representation, with practical examples and calculations to enhance understanding.

6th Grade Science Review: Minerals, Rocks, Living Matter, and Speed Concepts
E N D
Presentation Transcript
DCA Week 24 Review 6th Grade Feb 26, 2013
Minerals • 6 Ways to Classify Minerals: • Hardness (How it breaks) • Luster • Density • Texture • Color • Streak Remember: Streak shows the true color of the mineral. Streaks are more reliable than color.
Rock Cycle: Classified by how they are formed • Sedimentary Rock: pieces of sediment compacted and cemented together • Metamorphic Rock: Heat and pressure • Igneous Rock: Volcanic Activity (cooled and hardened)
Living Matter • Remember in the beginning of the school year we talked about the elements that are in living matter: • Oxygen & Hydrogen are 2 elements in living matter
Pulleys • Pulleys are used mainly to help decrease the amount of force needed to pull up an object.
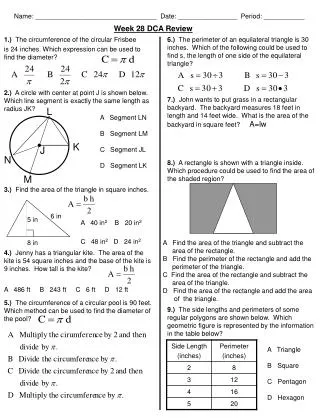
Speed • average speed S= D T • S= D ÷ T • Example: • A truck driver drove 270 km in 3 hours. What is the trucks average speed? • Answer: 90 km/h
Speed • Find the average speed:
Distance Vs Time • Car 4 has the LOWEST average speed and car 1 has the HIGHEST average speed. • The steepness of a slope on graph shows how quick or slow an object is moving • Which car is moving the fastest? • Which car is moving the slowest? • Remember when graphing Distance and time that Distance must be on the Y-axis while Time is on the X-axis
Linear Vs. Nonlinear • Linear: straight line • Nonlinear: not a straight line
Lets practice calculating average speed: • Mary ran 1760 yards in 2 hours. What was Mary’s average speed? • John rode his bike 6 km in 3 hours. What was John’s average speed? • A car travels up a hill at 90 km in 2 hours. What is the average speed?