Project Guidelines and Class Activities for June 1st and 7th
40 likes | 157 Vues
Students are reminded to bring hard copies of their project, including cover sheets, papers, and Excel spreadsheets, to class on June 1st. It's crucial to thoroughly read the project description to ensure all aspects are included, particularly the data description in both written and graphical formats comparing to the 50th and 85th percentiles. Students will apply statistical inference methods to analyze their findings and conclude on the null hypothesis. On June 5th, suggestions for class activities are welcomed, while June 7th features an organized potluck.

Project Guidelines and Class Activities for June 1st and 7th
E N D
Presentation Transcript
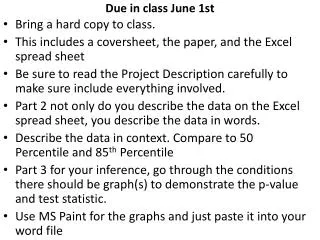
Due in class June 1st • Bring a hard copy to class. • This includes a coversheet, the paper, and the Excel spread sheet • Be sure to read the Project Description carefully to make sure include everything involved. • Part 2 not only do you describe the data on the Excel spread sheet, you describe the data in words. • Describe the data in context. Compare to 50Percentile and 85th Percentile • Part 3 for your inference, go through the conditions there should be graph(s) to demonstrate the p-value and test statistic. • Use MS Paint for the graphs and just paste it into your word file
Parts 3 and 4 from Project Description Part 3(Inference) – Once you have summarized the data with numbers and graphs you will compare it (based on your hypotheses) to the data published for the 50th percentile OR the standards to meet the Presidential Physical Fit status. Using your data and your hypotheses, you will complete the appropriate inference tests. State the conditions and determine if they are met, before proceeding with significance tests. Remember there are three events you are looking comparing. You will state the tests you completed and the results (p-value, and test statistic, in addition to a graph of a normal distribution or chi-square model curve relating these numbers). You will also explain your findings in words. Part 4(Conclusion)- Based on Part 2 and Part 3, describe if you reject or fail to reject your null hypothesis. Explain using the numbers and statistics you calculated in both parts to support your answer in context of the problem. Also include your reaction to the results based on your findings and any other conclusions you have made.
How to Label Axis on Graphs for Part 2 • Click on Graph • Then go to Design Tab • Scroll through designs OR to got to Layout Tab to select labels and grid, etc.
Ideas for June 5th and 7th • June 7th we will have a potluck. But it will be an organized potluck. People will sign up to bring drinks, food, desert, plastic ware, plates, cups, etc. • June 5th I will be accepting suggestions as to what we will do in class. If I don’t like any of the suggestions, I will be showing a documentary called “Between the Folds” about the art and math behind origami.