SPSS Basics I
SPSS Basics I. NOTE: Accessing Workshop Handouts Log on to your computer. Go to: http:// answers.umhb.edu/technology/miscellaneous Open and save to Desktop: SPSS Instructions.pptx SPSS Workshop – Data Analysis Guide.docx Client Satisfaction Codebook.docx SPSS Workshop 2012 Data.xlsx

SPSS Basics I
E N D
Presentation Transcript
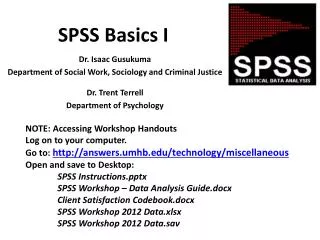
SPSS Basics I NOTE: Accessing Workshop Handouts Log on to your computer. Go to: http://answers.umhb.edu/technology/miscellaneous Open and save to Desktop: SPSS Instructions.pptx SPSS Workshop – Data Analysis Guide.docx Client Satisfaction Codebook.docx SPSS Workshop 2012 Data.xlsx SPSS Workshop 2012 Data.sav Dr. Isaac Gusukuma Department of Social Work, Sociology and Criminal Justice Dr. Trent Terrell Department of Psychology
Learning Objectives • Opening SPSS, Uploading and Saving files • Loading an Excel spreadsheet into SPSS • Setting up an SPSS data file • Conducting Frequencies • Conducting a Chi-square Goodness of Fit test
Opening SPSS Note: UMHB is licensed for 30 users at one time. • Click Windows “Start” button • Click “All Programs” • Click “IBM SPSS Statistics” • Open “IBM SPSS Statistics 19”
IBM SPSS Statistics 19 Dialogue Box If interested, Run the Tutorial, later. Click “Cancel”
Loading an Excel file into SPSS • Click the “Open data document” icon in the upper left corner 2. “Open Data” dialogue box, go to the location of the excel file you want to open. 3. Change “Files of type” to “Excel” 4. Highlight the Excel file you want to open. 5. Click “Open”
6. “Opening Excel Data Source” dialogue box will open. Click “OK” letting SPSS know that the first row in the Excel data file are the variable names.
SPSS opens a “Data Editor” screen, like that below. This is your Excel data converted to an SPSS data file. First row in the Excel spreadsheet becomes the “header” or variable name in SPSS.
Note the red arrow. There are two (2) views, the Data View and the Variable View. Click the tabs to see what these two views look like. • The next step is setting up SPSS for your data. • You will use the “Variable View” to do this.
In Variable View look at the column headings, “Name,” “Type,” etc. • Click on a cell and you will be able to edit the information in it, e.g. if you don’t like “id” as the name for the first variable, you can highlight the cell and type in “Ident” • Some cells (Type, Decimals, Values, Missing) have pull down menus. • Click on the cells to get a feel for ways to edit the information for each variable.
Using the Codebook, edit the description and values for the variable that need the information. (The first couple variable will take some time, but once you get the idea, it moves very quickly.) • Verify the “Name” for each of your variables. They will be in the order that you had them in the first row of your Excel data file. • Under “Type” keep it “Numeric.” Note: that you can change to currency, date, etc. that could be useful for other types of calculations. • “Width” the default is “8” which is OK. With Excel width is “11” or “12” • “Decimals” default is “2” • “Label” enter the “Variable Label” from your Codebook. You may want to later edit this label. Shorter labels (two or three words) are best.
Using your Codebook, open the dialogue box for “Value Labels” (see below). The numeric value is typed into the “Value” box, then type the name of that response in the “Label” line. • Click “Add” and it will move the number and label down, see “1=Poor” • Click “OK” when all values are entered. Note: If you have variables with the same Value Labels (i.e., questions with same Likert scale), you can copy the value labels from a previously entered variable and paste it into other cells. You can highlight more than one cell and paste to several at one time.
“Missing Values” informs SPSS which numbers to ignore when doing computations. By telling SPSS that “99” is missing, it will exclude this and other Missing Values from statistical computations. • Open the “Missing Values” dialog box. Click “Discrete missing values” and enter up to three missing values. Common values used: 97, 98, 99 for “N/A” (not answered/not applicable), “Don’t Know,” etc. • Click “OK” Your data file is now set up.
Frequencies Junk in. Junk out. How to tell if your data file is “clean” or if there are data entry errors. Cleaning up your data file to be “error free.”