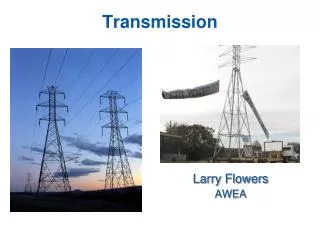
Transmission Design
This document presents an analysis of the original expansion of conventional generation and the integration of wind generation in the Great Lakes region, assuming a 20% capacity value for wind. The EGEAS expansion identifies the regional generation needed for reliability, including LOLE and ELCC analysis. Webinar discussions clarify the pricing and quantity of sources and sinks determining transmission requirements across four scenarios. The year-to-year variability in ELCC is attributed to hourly load and wind profiles from 2004 to 2006, revealing insights into CO2 reduction strategies for 2024.

Transmission Design
E N D
Presentation Transcript
Transmission Design EWITS Great Lakes Nov 2, 2009
Original Expansion of Conventional Generation Wind generation by scenario assumed to have 20% capacity value EGEAS expansion performed to identify regional generation needed for reliability Following LOLE/ELCC analysis, some of this generation could be deferred EWITS Technical Review Committee Webinar October 2, 2009
Overlays for 4 Scenarios Scenario 2 Scenario 1 Scenario 4 Scenario 3 EIWTS Technical Review Committee Webinar October 2, 2009
Price and Quantity of Sources and Sinks Determine Transmission Requirements
Overlays for 4 Scenarios Scenario 2 Scenario 1 Scenario 4 Scenario 3 EIWTS Technical Review Committee Webinar October 2, 2009
Year to Year ELCC Variability • Year to Year variation in the ELCC results is due to • The different Hourly Load & Wind Profiles (2004, 2005 & 2006) • And where the wind is located in each of the different Scenarios • As can be seen in the results a shift • As more wind was located in the East (Scenario 3 & 4)The 2006 profile contained the higher ELCC • As more wind was located in the West (Scenario 1)The 2004 profile contained the higher ELCC