Download
1 / 43
430 likes | 503 Vues
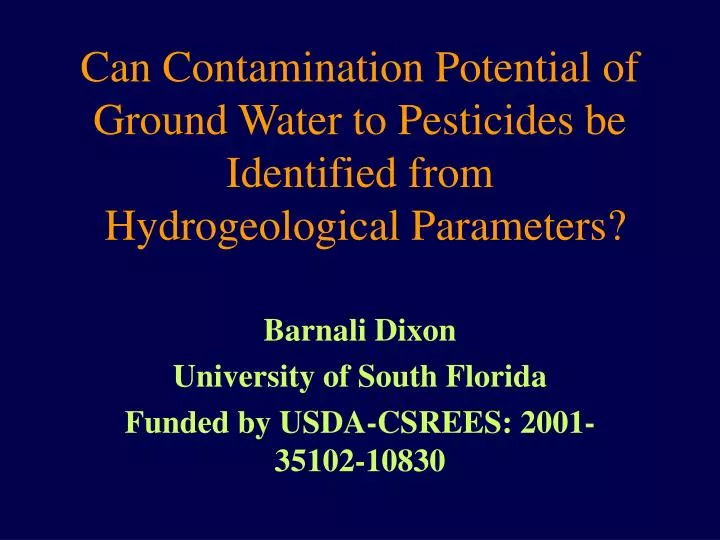
Can Contamination Potential of Ground Water to Pesticides be Identified from Hydrogeological Parameters?. Barnali Dixon University of South Florida Funded by USDA-CSREES: 2001-35102-10830. NPS!! The Problem!!. Low. Moderate. Moderately High. High. 0 miles 12.

E N D
Can Contamination Potential of Ground Water to Pesticides be Identified from Hydrogeological Parameters? Barnali Dixon University of South Florida Funded by USDA-CSREES: 2001-35102-10830
Low Moderate Moderately High High 0 miles 12 Solution: Contamination Potential MappingDRASTIC
Introduction • Arkansas has a state management plan (SMP) for pesticide monitoring of ground water • The Department of Environmental Quality (DEQ) routinely samples 76 irrigation wells in 5 counties • 61 pesticides and degradation products were analyzed by DEQ • Pesticide use is primarily for weed control in soybeans, cotton and rice
Objective • To determine the key hydrogeologic parameters that might play a critical role in contamination of ground water by pesticides using GIS and geostatistical approach). Key words: GIS & Geostatistics
Spatial Data Layers • Well Location/Contamination • Soils • Geology • Landuse • Thickness of the Confining Unit (claycap) • Recharge of Ground Water • Depth to GW
Sources of Spatial Data • Well Location/Contamination DEQ • Soils NRCS • Geology LGS • Landuse CAST • Claycap USGS • Recharge USGS • Depth to GW USGS
Number of Contaminated Wells for Each Pesticide Pesticide Number
Software • GRASS, version 4.2 • JMP, version 3.2 • GS+, version 3.1 • MultiSpec
240 m 160 m 320 m Analyses • GIS • Buffer Analysis • Coincidence • Statistical • Descriptive • Geostatistics
Prairie Complex MRMB1 ARMB1 Alluvium Backswamp VTEW2 VTLW2 Geology
20 15 Non Contaminated Bentazon Contaminated 10 Number of Wells 5 0 UC ARMB2 ARMB4 ARMB1 ARMB5 ARMB7 ARMB6 VTLW2 VTEW2 MRMB1 VTEWG1 Backswamp Geology Presence of Bentazon vs. Geology
Thickness of the Clay Cap Point data Clay Cap Interpolation Impact of Vadose Zone
meters 23 - 30 15 -23 6 - 9 9 - 12 2 - 3 Thickness of Claycap Non Contaminated Contaminated
30 Bentazon Non Contaminated 25 Contaminated 20 15 Number of Wells 10 5 0 4 - 6 7 - 9 10 - 12 13 - 15 2 - 3 Thickness of Claycap (m) Presence of Bentazon vs. Thickness of Claycap
Recharge of Ground Water Net Recharge MODFLOW Site File Interpolated R
cm/yr 0 - 5 6 - 10 11 - 18 19 - 25 Non Contaminated Contaminated 26 - 50 Recharge of Ground Water
60 50 40 Bentazon 30 Number of Wells 20 Non Contaminated 10 Contaminated 0 0 -5 6 - 10 11 - 18 19 - 25 26 - 50 Recharge (cm/yr) Presence of Bentazon vs Recharge
Development of Depth to Ground Water Potentiometric surface Elevation Subtract D
meters 0 - 5 5 - 14 14 - 18 18 - 27 > 27 Depth to Ground Water
35 Bentazon 30 25 20 Non Contaminated Number of Wells 15 Contaminated 10 5 0 Channel 0 - 5 6 - 13 Depth to Ground Water (meters) Presence of Bentazon vs. Depth to GW
Soils • STATSGO (1:250,000) • mapping units: soil associations • SSURGO (1:24,000) • mapping units: soil series • surface texture • drainage class • permeability class
Perry-Portland-Rilla Calloway-Henry-Grenada Sharkey-Alligator-Tunica Loring-Memphis-Collins Rilla-Herbert-Perry Sacul-Savannah-Sawyer Smithdale-Savannah-Sacul Foley-Jackport-Crowley STATSGO Soils Crowley-Stuttgart-Hillemann Non Contaminated Contaminated
25 Non Contaminated 20 Contaminated 15 Number of Wells 10 5 0 Perry-Portland-Rilla Rilla-Hebert-Perry Sharkey-Alligator-Tunica Dundee-Sharkey-Bosket Commerce-Sharkey-Foley Calloway-Henry-Greneda Foley-Jackport-Crowley STATSGO Soils Associations Presence of Bentazon vs. STATSGO Soil Associations
Clay Silty clay Silt loam Silty clay Fine sandy loam SSURGO: Surface Soil Texture
35 30 Bentazon 25 Number of Wells 20 Non Contaminated Contaminated 15 10 5 0 Fine sandy Silt loam Silty Clay Clay SSURGO N/A loam Surface Textural Classes Presence of Bentazon vs. Surface Soil Texture
Very poor Poor Somewhat poor Moderately well SSURGO: Soil Drainage Classes
30 Bentazon 25 20 Non Contaminated Number of Wells 15 Contaminated 10 5 0 Poor Somewhat Well SSURGO N/A Moderately well Poor Drainage Classes Presence of Bentazon vs. Soil Drainage Class
cm/hr 1.5 - 5.0 0 - .15 0 - 5 0.15 - 0.5 0.5 - 1.5 5 - 15 15 - 50 Water SSURGO: Soil Permeability Classes
35 Bentazon 30 Non Contaminated 25 Contaminated Number of Wells 20 15 10 5 0 0.0 - 0.15 0.15 - 0.5 0.5 - 5.0 1.5 - 5.0 5.0 - 15.0 SSURGO N/A Permeability Classes (cm/hr) Presence of Bentazon vs. Soil Permeability Class
2000 Landuse Landsat TM • Spring • Summer
Urban Bare Soil Barren Forest Flooded Water Spring Landuse Non Contaminated Contaminated
Presence of Bentazon vs. Spring Landuse 50 45 40 Non Contaminated 35 Contaminated 30 Number of Wells 25 20 15 10 5 0 Bare Soil Baldcypress Willow Oak Wheat/Oats Herbaceous/Pasture Forest Unclassified Spring Landuse
Urban Cotton Soybeans Forest Rice Water Summer Landuse Non Contaminated Contaminated
Presence of Bentazon vs. Summer Landuse 30 25 Non Contaminated 20 Contaminated Number of Wells 15 10 5 0 Rice Cotton Bare Soil Soybeans Baldcypress Willow Oak Sorghum/Corn Herbaceous/Pasture Forest Unclassified Summer Landuse
SHARKEY-ALLIGATOR-TUNICA RILLA-HEBERT-PERRY PERRY-PORTLAND-RILLA Soybeans FOLEY-JACKPORT-CROWLEY 6 - 13 m Wheat/Oats Sorghum/Corn DUNDEE-SHARKEY-BOSKET COMMERCE-SHARKEY-FLUVAQUENT Rice Perennial Water 0 - 5 m CALLOWAY-HENRY-GRENADA Perennial Water Pasture Pasture Channel Cotton Bare Soil Bare Soil STATSGO Soil Associations Spring Landuse Summer Landuse Depth to GW Arkansas River meander belt6 Valley train of early Wisconsin glaciation Arkansas River meander belt7 Contaminated Arkansas River meander belt5 Arkansas River meander belt4 2 - 3 m 20 - 25 cm/yr Arkansas River meander belt2 Arkansas River meander belt1 12 - 15 m 13 - 18 cm/yr Valley train of early Wisconsin glaciation 2 Valley train of late Wisconsin 2 Upland complex 9 - 12 m 8 - 10 cm/yr Non Contaminated Mississippi River meander belt1 Backswamp 6 - 9 m 28 - 50 cm/yr 3 - 6 m 0 -5 cm/yr Geology Thickness of claycap Recharge Bentazon contamination Presence of Bentazon vs. critical parameters within buffer zone
Conclusions • Contamination coincided with • bare soil in spring • cotton and soybeans in summer • mostly coarser-textured soils • depth to GW of 0 - 5 m • backswmp • No spatial correlation was found from semivariogram analyses
Conclusions cont…. • Each of the natural resource parameters has its own spatial distribution which affects spatial variability of well contamination • Further studies needed • Data Layers (soil structure, bulk density, Ksat) • Methodology (e.g. neural networks)
How do we incorporate this layer in the model?? Hydropedology ? New Branch of Study?? Photomicrograph of a thin section