Understanding Earned Value Management Techniques with Cost Performance Metrics
This guide provides insights into Earned Value Management (EVM) techniques, focusing on key metrics like Cost Variance (CV), Schedule Variance (SV), and Performance Indices (CPI and SPI). It explores the concepts of 50/50 and 0/100 techniques to recognize progress in project management, as well as how to assess whether milestones are being met. Additionally, it covers the importance of accurate forecasting and managing repetitive tasks while maintaining an ideal level of effort. Overall, the content aims to enhance understanding of value earned through effective cost management strategies.

Understanding Earned Value Management Techniques with Cost Performance Metrics
E N D
Presentation Transcript
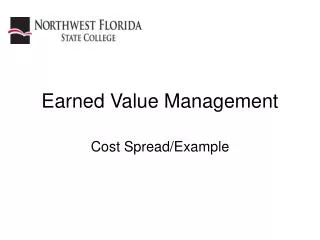
Earned Value Management Cost Spread/Example
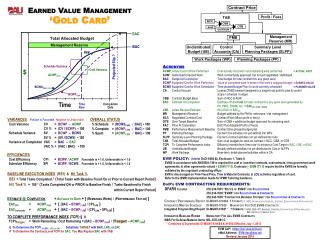
SpreadingTechniques • How do we “earn value” ??? • 0/100% • Critical to finish • 50/50% • Want to recognize start, but finish is still important • % complete • Most accurate, but requires admin staff • Balanced Level of Effort • Repetitive tasks • Directed Milestone • Use if critical events represent value
Example Task Cost Start End WP1 10 1 3 WP2 10 3 7 WP3 10 3 4 WP5 20 6 9 WP5 10 1 10
1 2 3 4 5 6 7 8 9 10 WP1 WP2 WP3 WP4 Monthly BCWS Cumulative BCWS WP5 Example BCWS 50/50 (10) 0/100 (10) 50/50 (10) % (20) LOE (10)
1 2 3 4 5 6 7 8 9 10 WP1 WP2 WP3 WP4 Monthly BCWS Cumulative BCWS WP5 Example BCWS 5 3 2 50/50 (10) 2 4 1 1 2 0/100 (10) 2 8 50/50 (10) 4 5 % (20) 6 5 1 1 1 1 1 1 1 1 1 1 LOE (10) 6 4 7 13 2 6 9 6 6 1 6 10 17 30 32 38 47 53 59 60
1 2 3 4 5 6 7 8 9 10 WP1 WP2 WP3 WP4 Monthly ACWP Cumulative ACWP WP5 Example ACWP 50/50 (16) 0/100 (11) 50/50 (10) % (22) LOE (10) WP4 was completed in 20% week 1, 50% week 2, and 30% week 3
1 2 3 4 5 6 7 8 9 10 WP1 WP2 WP3 WP4 Monthly ACWP Cumulative ACWP WP5 Example ACWP 0 7 9 50/50 (16) 0 3 8 0 0 0/100 (11) 4 6 50/50 (10) 6 0 % (22) 6 10 1 1 1 1 1 1 1 1 1 1 LOE (10) 1 8 14 10 9 7 7 11 1 1 1 9 23 33 42 49 56 67 68 69
1 2 3 4 5 6 7 8 9 10 WP1 WP2 WP3 WP4 Monthly BCWP Cumulative BCWP WP5 Example BCWP 50/50 (10) 0/100 (10) 50/50 (10) % (20) LOE (10)
1 2 3 4 5 6 7 8 9 10 WP1 WP2 WP3 WP4 Monthly BCWP Cumulative BCWP WP5 Example BCWP Did I start? Did I finish? What % did I do * total $ 0 5 5 50/50 (10) 0 0 10 0 0 0/100 (10) 5 5 50/50 (10) 4 0 % (20) 10 6 0 1 1 0 1 1 1 1 0 1 LOE (10) 0 6 11 5 11 5 11 7 0 1 0 6 17 22 33 38 49 56 56 57 Did I actually do the LOE scheduled (or meet the milestone)? WP4 was completed in 20% week 1, 50% week 2, and 30% week 3
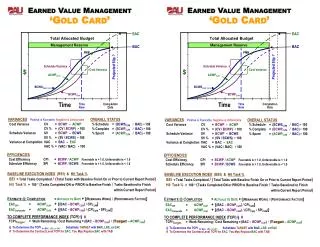
Week 4 • Schedule Variance SV = BCWP – BCWS SV = 22 – 30 = -8 • On/Off plan in dollars (>0 is ahead, 0 is on target, <0 is behind) • Schedule Performance Index SPI = BCWP/BCWS SPI = 22/30 = .73 • On/off plan as a ratio (>1 is ahead, 1 is on target, <1 is behind) • Cost Variance CV = BCWP – ACWP CV = 22 -33 = -11 • Over/under running (>0 is underrun, 0 is on target, <0 is overrun) • Cost Performance Index CPI = BCWP/ACWP CPI = 22/33 =.666 • Return on actual costs (>1 is under, 1 is on target, <1 is over)