Non-Experimental designs
Non-Experimental designs. Psych 231: Research Methods in Psychology. It was a difficult exam (I have adjusted scores by 5%, an error and a bad question were tossed out) Mean = 70.6 Max = 100 Min = 47.5. Exam 2. Most common area of errors between/within manipulations


Non-Experimental designs
E N D
Presentation Transcript
Non-Experimental designs Psych 231: Research Methods in Psychology
It was a difficult exam (I have adjusted scores by 5%, an error and a bad question were tossed out) • Mean = 70.6 • Max = 100 • Min = 47.5 Exam 2
Most common area of errors • between/within manipulations • interactions/main effects • validity/reliability • If you’d like to go over your exam, contact me and we’ll set up a time to go through it Exam 2
How do I estimate my current grade? • Take your current score for each assignment type (or average) and multiply it by the percentage that it is worth Example: Ex 1: 87 87 * 15% = 13.05 Ex 2: 72 72 * 15% = 10.80 JS 1: 89 89 * 5% = 4.45 CPdft1: 92 92 * 5% = 4.60 LabEx*: 100, 100, 85, 0, 79 avg = 72.8 * 15% = 10.92 GrpP*: 100, 95, 100 avg = 98.3 * 15% = 14.75 70% 58.57 So estimate of current grade = 58.57/70 = 83.7% which is a B * doesn’t include participation grade, which will be weighted differently Estimating your current grade
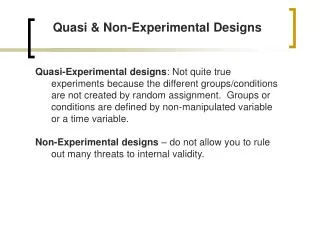
Sometimes you just can’t perform a fully controlled experiment • Because of the issue of interest • Limited resources (not enough subjects, observations are too costly, etc). • Surveys • Correlational • Quasi-Experiments • Developmental designs • Small-N designs • This does NOT imply that they are bad designs • Just remember the advantages and disadvantages of each Non-Experimental designs
Time series designs • Basic method: Observe a single group multiple times prior to and after a treatment treatment Obs Obs Obs Obs Obs Obs • The pretest observations allow the researcher to look for pre-existing trends • The posttest observations allow the researcher to look for changes in the trends • Is it a temporary change, does it last, etc.? Quasi-experiments
Obs Obs Obs Obs Obs Obs treatment Obs Obs Obs Obs Obs Obs • A variation of basic time series design • Addition of a nonequivalent no-treatment control group time series • Time series designs Quasi-experiments
Used to study changes in behavior that occur as a function of age changes • Age typically serves as a quasi-independent variable • Three major types • Cross-sectional • Longitudinal • Cohort-sequential Developmental designs
Cross-sectional design • Groups are pre-defined on the basis of a pre-existing variable • Study groups of individuals of different ages at the same time • Use age to assign participants to group • Age is subject variable treated as a between-subjects variable Age 4 Age 7 Age 11 Developmental designs
Advantages: • Can gather data about different groups (i.e., ages) at the same time • Participants are not required to commit for an extended period of time • Cross-sectional design Developmental designs
Disavantages: • Individuals are not followed over time • Cohort (or generation) effect: individuals of different ages may be inherently different due to factors in the environment • Are 5 year old different from 15 year olds just because of age, or can factors present in their environment contribute to the differences? • Imagine a 15yr old saying “back when I was 5 I didn’t have a Wii, my own cell phone, or a netbook” • Does not reveal development of any particular individuals • Cannot infer causality due to lack of control • Cross-sectional design Developmental designs
Follow the same individual or group over time • Age is treated as a within-subjects variable • Rather than comparing groups, the same individuals are compared to themselves at different times • Changes in dependent variable likely to reflect changes due to aging process • Changes in performance are compared on an individual basis and overall • Longitudinal design time Age 11 Age 15 Age 20 Developmental designs
Example • Wisconsin Longitudinal Study(WLS) • Began in 1957 and is still on-going (50 years) • 10,317 men and women who graduated from Wisconsin high schools in 1957 • Originally studied plans for college after graduation • Now it can be used as a test of aging and maturation Longitudinal Designs
Advantages: • Can see developmental changes clearly • Can measure differences within individuals • Avoid some cohort effects (participants are all from same generation, so changes are more likely to be due to aging) • Longitudinal design Developmental designs
Disadvantages • Can be very time-consuming • Can have cross-generational effects: • Conclusions based on members of one generation may not apply to other generations • Numerous threats to internal validity: • Attrition/mortality • History • Practice effects • Improved performance over multiple tests may be due to practice taking the test • Cannot determine causality • Longitudinal design Developmental designs
Measure groups of participants as they age • Example: measure a group of 5 year olds, then the same group 10 years later, as well as another group of 5 year olds • Age is both between and within subjects variable • Combines elements of cross-sectional and longitudinal designs • Addresses some of the concerns raised by other designs • For example, allows to evaluate the contribution of cohort effects • Cohort-sequential design Developmental designs
Cohort-sequential design Time of measurement 1975 1985 1995 Cohort A 1970s Age 5 Age 5 Age 5 Cross-sectional component Cohort B 1980s Age 15 Age 15 Cohort C 1990s Age 25 Longitudinal component Developmental designs
Advantages: • Get more information • Can track developmental changes to individuals • Can compare different ages at a single time • Can measure generation effect • Less time-consuming than longitudinal (maybe) • Disadvantages: • Still time-consuming • Need lots of groups of participants • Still cannot make causal claims • Cohort-sequential design Developmental designs
What are they? • Historically, these were the typical kind of design used until 1920’s when there was a shift to using larger sample sizes • Even today, in some sub-areas, using small N designs is common place • (e.g., psychophysics, clinical settings, expertise, etc.) Small N designs
One or a few participants • Data are typically not analyzed statistically; rather rely on visual interpretation of the data • Observations begin in the absence of treatment (BASELINE) • Then treatment is implemented and changes in frequency, magnitude, or intensity of behavior are recorded Small N designs
Baseline experiments – the basic idea is to show: • when the IV occurs, you get the effect • when the IV doesn’t occur, you don’t get the effect (reversibility) • Before introducing treatment (IV), baseline needs to be stable • Measure level and trend Small N designs
Level – how frequent (how intense) is behavior? • Are all the data points high or low? • Trend – does behavior seem to increase (or decrease) • Are data points “flat” or on a slope? Small N designs
ABA design (baseline, treatment, baseline) • The reversibility is necessary, otherwise • something else may have caused the effect • other than the IV (e.g., history, maturation, etc.) ABA design
Advantages • Focus on individual performance, not fooled by group averaging effects • Focus is on big effects (small effects typically can’t be seen without using large groups) • Avoid some ethical problems – e.g., with non-treatments • Allows to look at unusual (and rare) types of subjects (e.g., case studies of amnesics, experts vs. novices) • Often used to supplement large N studies, with more observations on fewer subjects Small N designs
Disadvantages • Effects may be small relative to variability of situation so NEED more observation • Some effects are by definition between subjects • Treatment leads to a lasting change, so you don’t get reversals • Difficult to determine how generalizable the effects are Small N designs
Some researchers have argued that Small N designs are the best way to go. • The goal of psychology is to describe behavior of an individual • Looking at data collapsed over groups “looks” in the wrong place • Need to look at the data at the level of the individual Small N designs