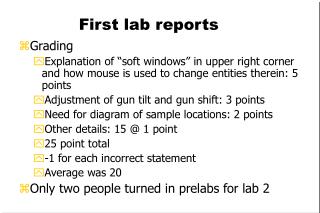

Lab Reports
E N D
Presentation Transcript
Semantics • No personal pronouns (i.e. I, me, us, you, our, etc.) • Not: I massed the sample. • Instead: The sample was massed. • Rationale: The focus of the paper is the experiment, not you. • Less is more. • Do not repeat thoughts. • Be concise. • This is not creative writing, but scientific writing. • Be direct with thoughts and ideas.
More Semantics • 12 Point Font • 1 Inch Margins • Everything is double spaced, except the abstract (single spaced) • Times New Roman or similar font • Individually completed (unless specified) • Well written papers generally are 4-7 pages
Other Things • Avoid get/got • Do not say “Thank you” • Transition between paragraphs • No new ideas in conclusion paragraph • Grammar is vital • Learn to use commas • Proofread
Parts of the Paper • Title • Abstract • Introduction • Procedure • Results • Discussion • Title of paper and each section title should be in bold font.
Header • Page One: In top right corner, as a header, have your full name, course, and date single spaced. Karen Collier Honor Chemistry September 29, 2014 • Other Pages: First Initial and page number in top right corner. K. Collier 2
Title • Should explain the purpose of the experiment. • Okay to be creative, but not so abstract no one will understand. • The Sticky Truth: The Percent of Sugar in Bubble Gum • The Heat is On: The Effect of Temperature of Heart Rate after Exercise in High School Students • As a last resort, if you cannot think of anything else, restate the name of the experiment.
Abstract • A single paragraph that provides enough incite into the paper to have the reader determine if they wish to read it. • Scientific Method in a concise statement. • Observation: What is the problem? • Hypothesis: What is the expected outcome? • Procedure: One to two sentence to have reader understand the premise of experiment. • Result: Raw information. • Tobacco plants grew at faster rates with fertilizer. • Conclusion: One or two sentences of what the results mean and was the hypothesis supported.
Introduction • Has nothing really to do with the experiment. • Provides reader with background information needed to understand the science behind the experiment. • Depending on writing style, introduction is usually about 1 to 2 pages. • It is the science behind the experiment. • Explain the functions of the circulatory system. • What is molar mass, and how is calculated? • Do not copy the textbook or have choppy sentences.
Procedure • Use complete sentences in paragraph form. • Do not use I, we, us, etc. • Explain how to exactly replicate the experiment, but do not say Step 1. • Be care of being redundant. If a procedure is completed multiple times: • In trial two, the baking soda is replaced with corn starch, and the previous procedure is repeated. • Do not include any data or results in this section.
Results • Short paragraph that highlights what you want the reader to focus on: maximum values, minimum values, trends, averages, and outliers. • Do not explain why here; that is discussion. • Graphs • Use Excel or similar computer program. • Graphs are included after the discussion and labeled Figure 1, Figure 2, and referred to in the results paragraph. • Title: explains the graph. • Effect of Temperature on Mood in Middle School Students • Label Axis and Use Units • Generally, use a scatter plot for trends. Bar graphs are for comparisons. • Do not use both a data table and a graph. If you can graph it, always go with the graph.
Discussion • Why did you do this experiment? • Explain what your result imply. • Was your hypothesis correct? • If not, what do you think the answer was? • Errors and how to improve or eliminate those. • Improvements or modifications of interest that could be done to the experiment. • How does this relate to the real world? • Make a connection with the experiment to some aspect outside the classroom. • Conclusion Paragraph: Sum up the entire paper/experiment in a paragraph. • Do not introduce new ideas in last paragraph.