Boone Central Data In-service
This presentation from Boone Central’s In-Service on January 4, 2011, emphasizes the critical role of data in educational outcomes. Scott Ebbrecht, Principal from Westernville, Ohio, highlights the importance of addressing teacher practices over student characteristics to enhance achievement. Key concepts include differentiating between problems and conditions, implementing strategies like mentoring programs, and engaging in data-driven dialogue among educators to foster continuous improvement. The discussion stresses the collective responsibility to help all students learn effectively.

Boone Central Data In-service
E N D
Presentation Transcript
Boone Central Data In-service January 4th 2011
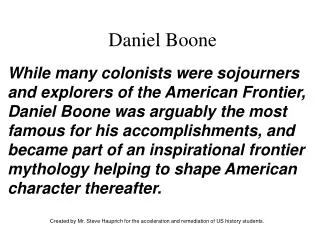
“Without data, you’re just another person with an opinion.” Scott Ebbrecht, Principal in Westernville, Ohio
Aim of the District District Goals& Measures Random Acts of Improvement
Aim of the District District Goals & Measures Aligned Acts of Improvement
Teachers were asked “To what attribute do you attribute the lack of achievement of your students?” • Some teachers indicated characteristics of students, lack of motivation, their parents, socioeconomic status, etc. • Some teachers indicated things that teachers do, looking at their skills. • Students taught by teachers who were concerned about teacher skills achieved 3 times higher than those whose teachers cited student characteristics.
The Real Question • What is it that WE are doing that might contribute to these results? • The objective here is to reflect about our practices and determine where WE can improve what WE do.
Problem or Condition • A “problem” is something we can do something about, so we can focus time and energy in that direction. • A “condition” is something that we cannot do anything about—we acknowledge it and go around it, but we do not waste time trying to change it.
For Example… • Through disaggregation we find students from single parent families are not reading at grade level by 3rd grade. • Coming from a single parent family is a condition. • Reading below grade level is a problem. • Strategies and interventions can be implemented based on the condition. • Establish a mentor program. • Create a before or after school program.
Some Ground Rules • Don’t blame kids; it is not their fault. • Don’t use kids as excuses. • Don’t blame teachers. • Data is just information about the current state of affairs. • These are our students. • The real question is “What are we going to help our students learn.”
continuous improvement • members of an organization acquire and use information to change and implement action
use data to: • ask the right questions • define needs • plan interventions • evaluate progress
viewing data • program • cohort • individual student
Data Driven Dialogue • Phase I: Predictions • Phase II: Observations • Phase III: Inferences
Data Driven Dialogue • Determine in your teams what data you will be looking at. • Progress through the dialogue into Phase III when appropriate.
Data Driven Dialogue • Grade Band or Subject Area Data Teams • PK-1, 2-3 and 4-5 • Language Arts, Math, Science, Social Studies and Career & Technical Education Resource, PE, Music, and Art: • Split up evenly into the above groups (an outside and possibly broader perspective)
Data Driven Dialogue • Determine in your teams what data you will be looking at. • Progress through the dialogue into Phase III when appropriate. GROUPS: K-1, 2-3, 4-5, LA, Math, Science, SS, Career & Tech Ed NeSA, NWEA, State of the Schools Report, DIBELS, others needed?
Bubble Student Defined A score determined to be approximately: 3-4 questions below or 2-3 questions above a proficient or grade level score.
Bubble Student Defined NeSA - RM • 135-200 Exceeds • 85-134 Meets • 0-84 Does Not Meet • Bubble Set @ 90-72 (+5 & -8) NeSA – W • 4.0-8.0 Meets • 0-3.99 Does Not Meet • Bubble Set @ 5.0-3.0
Bubble Student Defined NWEA MAP • +2 and -5 of the National Norms • National Norm is determined by mean (average) score at that grade level for that time of year (fall, winter, spring). Blue – Exceeds NeSA, Above Bubble MAP Green – Meets NeSA Yellow – Bubble Students (NeSA & MAP) Red – Does Not Meet NeSA, Below Bubble MAP
Data Analyzer • Went back 2 years • We set the cut scores • We can add demographics or alter inputs • We can get more detailed as needed This is a starting point.
Pick 3 • Each teacher picks 2-3 Bubble Students. • Help them within your abilities, but outside the normal classroom routine. • Utilize Data • Content Specific • Skill Improvement • Motivator • Ideas? • NeSAis the first priority