Download
1 / 42
420 likes | 554 Vues
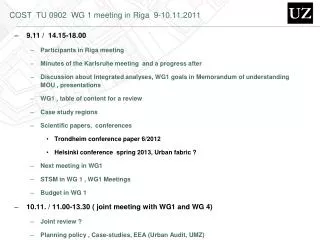
COST TU 0902 WG 1 meeting in Riga 9-10.11.2011 . 9.11 / 14.15-18.00 Participants in Riga meeting Minutes of the Karlsruhe meeting and a progress after Discussion about Integrated analyses , WG1 goals in Memorandum of understanding MOU , presentations

E N D
COST TU 0902 WG 1 meeting in Riga 9-10.11.2011 • 9.11 / 14.15-18.00 • Participants in Rigameeting • Minutes of the Karlsruhemeeting and a progressafter • DiscussionaboutIntegratedanalyses, WG1 goals in Memorandum of understanding MOU , presentations • WG1 , table of content for a review • Case studyregions • Scientificpapers, conferences • Trondheim conferencepaper 6/2012 • Helsinki conferencespring 2013, Urbanfabric ? • Nextmeeting in WG1 • STSM in WG 1 , WG1 Meetings • Budget in WG 1 • 10.11. / 11.00-13.30 ( jointmeetingwith WG1 and WG 4) • Jointreview ? • Planningpolicy , Case-studies, EEA (Urban Audit, UMZ)
List of participants in Rigameeting • Mika Ristimäki , chair of WG1 , SYKE / Helsinki mika.ristimaki@ymparisto.fi • Jonathan Köhler, vice-chair WG1, ISI / Karlsruhe. J.koehler@isi.fraunhofer.de • Gerald Leindecker, Linz, office@leindecker.at • KestusisZaleckis, Lithuania, kestutis.zaleckis@ktu.lt • DragutinMihailovic, Serbia, guto@polj.uns.ac.rs • JaumeFons, (EEA, Spain) jaume.forns@vab.es • Gabor Dombay, Budabest, dombay.gabor@ybl.szie.hu • Vincent Viguié,CERED Paris, viguie@centre-cired.fr • Efren Feliu, Technalia / Bilbao, efren.feliu@tecnalia.com • Michael Neuman, U,NSW, Australia m.neuman@unsw.edu.au
Minutes of the Karlsruhe 13-14.7.2011 meetingand a progressafter • Four speakers were present at the meeting:Ristimäki (FI), Feliu (ES), Viguie (FR), Köhler (DE) • The key messages from these presentations were: • The need to have an agreement about what Integrated Modelling is and how it fits into IA methods in general. • There may be common themes to all integrated Assessment analysis of cities, they all have a specific geographical frame of reference (the definition of the region to be analysed) and use population and geographical information together with economics in the assessment. • The following structure for the WG1 survey was agreed: • WG1 table of content for a review of urban IA studies • Mika Ristimäki [MR] introduced the agenda and explained the objectives of the MC meeting, which were to: • To present possible contributions to the WG1 case studies of Integrated Assessment methodologies for cities • To develop a structure for the first WG1 survey of Integrated Assessment methodologies. • Advance the WG programme and develop the plans for the coming year. Identify productive Short Term Scientific Missions (STSMs). • The participants presented their proposed case studies. • MR presented the results of the EU PLUREL project on peri-urban development in the EU. Peri-urban areas are defined as being in transition between rural and urban structures, forming a new area of interest outside the suburban areas of cities. An analysis of Helsinki and the land use and transportation developments has been undertaken and is proposed for inclusion as a case study in the WG1 review.
Efren Felieu [EF] presented a multicriteria environmental assessment of Vitoria, south of Bilbao. While this is not a full integrated assessment analysis, information has been collected and analysed across several different disciplines, which could be expanded into an integrated assessment. Therefore, consideration of this would make a useful contribution to the WG1 review. • Vincent Viguié (VV) presented the NEDUM model of Paris. Time patterns of urbanisation have been generated through modelling economic and transport patterns through time, using the differential equation approach of the CIRED NEDYM model. • JK presented the Tyndall Centre IA assessment of London, combing disciplines including economics, transport and flood risk analysis to develop scenarios of landuse patterns , climate change and consequent flooding risks and damage assessments for Greater London and the surrounding area. • There was a discussion of futher WG1 outputs over the rest of the action. One possibility is a powerpoint presentation of the results of the WG1 review. This is planned for 2012. A topic for further discussion is the potential for the application of agent based modelling for IA of cities. A further possible topic for discussion is the possible application of transitions theory ideas to urban integrated assessment. These will be discussed further in future meetings. • MR has a trainee working with him at SYKE. MR will ask the trainee to look for further relevant cases of IA for cities. TNO has an IA tool, which is used for consultancy and ARUP have also undertaken consultancy on IA for urban areas. • Two possible STSMs were discussed. MR would like to go on an STSM to Karlsruhe, to analyse the Karlsruhe public transport tram and S bahn system. VV would like to go to Bilbao, to calibrate the NEDUM model for Bilbao. • Next meeting. The next meeting of WG1 will be held in Spring 2012. When the draft wg1 review is presented in Brno, the possiblility of holding a joint meeting with other WGs will be discussed.
MOU, Review and collate the existing technologies, methodologies and case studies of integrated sustainability assessment at a city scale. • Sustainable development of cities involves a number of deeply inter-related challenges, e.g. climate impacts, resource use and waste. However, responses to the challenges of sustainable development are bound to have undesirable side-effects if they are not studied in an integrated way. Integrated assessment of the form, function and dynamics of change in urban areas represents a formidable challenge. A new generation of quantified integrated assessment methods is emerging that is highly innovative in a number of respects and has the potential to provide new tools to support the complex process of managing urban areas. These tools are increasingly integrating multiple facets of sustainability (e.g. multiple climate impacts, or consideration of adaptation and mitigation measures) yet they remain embryonic. Researchers are developing pioneering approaches to develop, previously unavailable, integrated methods for analysis and decision making within the complex coupled technological, human and natural systems that constitute urban areas. • The aim of this task is to bring together the scientists, engineers, planners and stakeholders with an interest in managing cities to share methods, experiences and ideas and explore different approaches to addressing this complex systems problem. The sub-tasks required for Task 1 are:
(i) Review approaches to sustainability appraisal in European cities by identifying the key needs of policy makers with regards sustainability in cities and the key metrics of sustainabilitycurrentlyemployed. • (ii) Review existing methods of integrated assessment, focusing on the limited methods currently available at the city scale, but also drawing on experience from other fields (e.g integrated coastal zone modelling) and scales (e.g. global integrated assessment modelling). • (iii) Explore application of different methods through sharing data, methodological expertise and case studyinformation. • (iv) Draw on outputs from Tasks 2-4 to explore how adaptation/mitigation, resource flows/ecosystem services and support for long term planning might be better incorporated into city-wide integrated assessment models. • (v) Make recommendations, identify future research needs and provide a schematic design for a systems-based integrated assessment framework for urban sustainability analysis. This will be supported by case study examples where possible.
WG1 , table of content for a review • Scope of study: What are the questions?What is modelled or assests ? ( land use model, transport model ) Key policy questions • Methodology/disciplines or academic fields: Geography, environment, economics, Scenarios • Data, data sources: Urban Audit, FARO, CORINLAND CORINAIR, Local datasets • Links with policy makers/Urban planners • Results of the case studies • Urbanisation, dynamics of urban form • Environmental impacts • Policy recommendations • Vulnerability and resilience • Were important connections between disciplines found that determined the results? • Conclusions • Added value of IA for urban planning; Can these methods/results be applied to other cities?
WG 1 Review, importantaspects • Introduction • Planning literature (articles, Perth, World Planning School Conf. 2011, TNO model system, ARUP?) • Urban IA models • Why IA modelling of cities? Planning aspects of urban development, significant feedbacks between aspects/disciplines • Complexity/trans-disciplinarity/trade-offs and synergies Discussion in WG1 : Shouldwecontain the planningpolicyanalyses into the WG1 review ? => Cooperationwith WG 4
COST Case study, comparisson the corridors and analyses of urbantransformationusin IA methods Case studies: • Helsinki-Lahti, Tampere ( Mika Ristimäki) • Praha-Liberec, Ostrava ( Lena Halounova) • Bilbao –Vittoria MCA analysis ( Efren Felieu) • Paris NEDUM ( Vincent Vigui´e) • London Tyndall ( Jonathan Köhler, Richard Dawson) • Anyother? The interest of case studiesbymailbefore 1.12. to Mika and Jonathan. 1 A4 paper for all case studies ; howyour case studywillcontribute to MOU wg1 tasks and wg1 reviewcontent) • Budapest , Gabor • Barcelona, Jaume • Linz , Gerala • Kaunas., Kestutis • Belgrad, Dragutin • Case studyregions in WG4? Oslo or Trondheim ?
Scientificpapers, conferences Trondheim conferencepaper 6/2012 • Mika and Jonathan willdraft the content of the paperbeforeend of january 2012 , WG 1 writersarewellcome to join into thispaper. • Content: Summary of the IA methods and case studies Helsinki conferencespring 2013, Urbanfabric ? • FinnishEnvironment Institute (SYKE) willorganize a scientificConferenceabout ”UrbanFaric” in spring 2013. • Anyotherarticlesorconferenses?
STSM and Nextmeetings • Lena Halounova was in Helsinki in lastOctober Next STMS in WG 1 • GeralaLeindecker => Helsinki SYKE • Vincent Viguie => Bilbao Technalia • Mika Ristimäki => KarlsruheFraunhoferinstitute ( April 2012) • Gabor Dombay => SYKE in Spring Nextmeetings • WG 1 meeting as part of wgleadersmeeting in Brussel on Jan./ Feb. WG1 16.2, • Trondheim 19-21.6.2012 • WG1 meeting 6.11.2012, Karlsruhe • Jointmeetingwith WG4 ?
NextSteps • Combine the WG results in PPT • Drafting the review; case studyresult, framework, scope • New case studyproposals in November • Next WG1 meeting in Februarylinked in WG leadersmeeting • Preparing the conferencepaper to Trondheim conference
COST case studies Commutingarea Travel behaviour Location of activities Travel surveys Pedestrianzone Public transport zone Travel profile Home environment Car-orientedzone Urbanform Travel-relatedzones of urbanform Lowmobility
Examples ( Mika Ristimäki and Lena Halounova)Helsinki-Lahti / Praha-LiberecTampere-Ostrava Proposal for the future cooperation • Processing of three various cities in each country having similar conditions for analyzing sustainable development: • number of inhabitants – for comparable city scale for land use, transport systems, • economical orientation – for comparable economical and social conditions, • distance to Helsinki/Prague boundary/centre – for comparable conditions for external employment sources and other economical sources concentrated in prevailing part in both capitals .
Lahti and Liberec • similar number of inhabitants - 100 000 • textile and jewelry industry, and wood processing in Liberec, wood processing, in Lahti • transport system, Liberec tram system, Lahti bus system • distance to capitals – about 100 km (100 km to Prague – 1 hours by bus, 100 km to Helsinki – 1 hour by train, highway connections) • winter and summer sport centers • Recreational town pairs including their neighborhood • Lahti City , recreational resort/town Vierumäki , Pajulahti in Finland • Liberec and Jablonec mountainous touristic region in the Czech Republic Tampere and Ostrava: • similar number of inhabitants - 300 000 • heavy industry, • university towns • transport system, Ostrava tram and bus system, Tampere bus system • distance to capitals – more than 100 km (300 km to Prague – 3 hours by train, 200 km to Helsinki – 2 hours by train, highway connections)
Methods • Method description and data exchange for the partner to be able to apply it for his already processed case city. • Mapping the urbanization with long time series in two cities in Finland and Czech Republic using methods and determine new information found by the partner´s one. • Definition of urban forms and transport relationships. • Urban classifications used in urban planning in the case cities according to already approved proposals and approved decisions. • Analyses of leisure time activities in urban and regional level focused also on aging population taking into account also green infrastructure and green corridors in urban form as the cheapest and the most natural human physical activity – walking.
Anticipated outcomes and deliverables • Comparison of two methods for land use determination in urban areas – their mutual relations, advantages, disadvantages, resolutions, scales, derived information, etc. as a case study. • Land use urban area types in Finland – cities with relatively new urban policy (19th – 21st century - and Czech Republic – cites with history since medieval period – intensity population, comparison of relation between areas of production and residential areas, city centers and subcenters (if exist) and recommendation for a sustainable urban planning policy for European towns – in the northern and central Europe • Transport systems in the different city pairs– types, intensity, distances to public city transport network, connection to their capitals – examples and recommendations for the spatial distribution for an efficient public city transport system. • Determination of indicators for suitable localization of recreational places for the aging part of population living in cities – in prevailing part in their suburb areas.
Travel-related Zones of Urban Form in Urban and Peri-Urban areas, Case Helsinki-Lahti corridor Tripproduction Commutingarea Travel behaviour Location of activities Travel surveys Pedestrianzone Public transport zone Travel profile Home environment Car-orientedzone Urbanform Travel-relatedzones of urbanform Lowmobility Mika Ristimäki Senior Researcher FinnishEnvironment Institute Unit of BuiltEnvironment Helsinki, Finland
COST Case study, Helsinki- Lahti • travelrelatedzonesof urbanformfrom the holecorridorcanbeutilised • describe and interpret the urbanform and travelpatternsin urban , peri-urbanareas and ruralareas in corridor • pedestrianzonesarestrongestwithinareas of highlevel of public transport service and weakest in outerperi-urbanareas. Sustainabilityurban design (SUD) analysesaroundrailwaysstations in corridor • there is almost no potential to increase the public transport use in outerperi-urbanareaswithoutlargescalepublic transport investments and location of intensifiedlanduse • rail-basedinnerperi-urbanregionhasbeensuccessful in creatingmorepolycentricurbanformwithlesscar-dependent life style • zonescanbegeneralized to a planningmethod, whichcanbeused to assess the effects of landuse and transportationsystemdevelopment • Planningpolicyanalysesin corridor • Futurescenarios in corridor and assesmentsusing IA methods
Pedestrian zones Public transport zones Car-orientedzones Travel relatedzones of urbanform • Travel relatedzones of urbanform • based on commonlyknownmethodologyapplied in manycountries (e.g. ABC planningpolicy) • development of planning tool for land use and transport system planning • definition of criteria for zones • definition of urban form and mobility profiles for each zone type • created in co-operation with land use and transport planners
Public transport zones are on more than 2 km distance of the CBD area and there is high level of service of public transport. • Intensivepublic transport zone • Public transport zone Pedestrian zones Public transport zones Car-orientedzones General criteria for the travelrelatedzones of urbanform • Criteria for travelrelatedzones is based on • distance to CBD area • distance to public transport stop • headwayfor public transport services • location of subcentra • Pedestrianzone is limited in 1,0–2,0 km radius of CBD area • Pedestrianzone is surroundedby a fringezone of the radius of 2-5 km radius of the pedestrianzone • In the metropolitanarea the subcentresform an independentpedestrianzone The area outside the pedestrian and public transport zones is car-orientedzone. Usually in largeurbanareasthere is alsosomepublic transport supply in car-orientedzones, but the public transport level of service is not as high as on public transport zones. In smallurbanareas the public transport supply of car-orientedzones is modest.
Travel relatedzonesin Helsinki Metropolitan Region • Travel relatedzones of urbanform on urban and peri-urbanarea • implementation of the zones on national level in 250x250 m grid cells • pedestrianzonesdescribe the polycentricnature of Metropolitan Region • Data • MUFFS data (Finnish Monitoring System of Urban Form and Spatial Structure) • public transport supply data • regional travel survey data
Urban, peri-urban and ruralareas in Helsinki Metropolitan Region Peri-urbanareashavealtogether 268 000 inhabitants
Features of Helsinki-Lahti corridor Tripproduction Commutingarea Travel behaviour Location of activities Travel surveys Pedestrianzone Public transport zone Travel profile Home environment Car-orientedzone Urbanform Travel-relatedzones of urbanform Lowmobility
Pop. Populationamountnear the railwaystations in 2010 (1 km distance)
Populationamountnear the railwaystations in 2010 (10 km distance)
Workplaceamountnear the railwaystations in 2010 (1 km distance)
Commutingdestinations ( workplacedensity) from Lahti to Helsinki region in 1980 and 2003
Commuters ( Lahti to Helsinki region) amount and field of industry in 2003 Lahdesta pääkaupunkiseudulle ja sen kehyskuntiin suuntautuneet työmatkat toimialoittain vuonna 2003 500 16 14 400 12 Työmatkojen 10 300 lukumäärä 8 (%) Työmatkojen 200 6 Työmatkojen lukumäärä Työmatkojen suhteellinen osuus suhteellinen osuus 4 100 2 0 0 Lielpa Majrav. Kauppa Infosekt. Teollisuus Korkea tekn. Kauppa: Marketing services Teollisuus:Industry Majrav: Restaurants and hotels Lielpa: Services to otherindustries Infosekt:Informationsector Korkeatekn: High--Tech
Kauppa: Marketing services Teollisuus:Industry Majrav: Restaurants and hotels Lielpa: Services to otherindustries Infosekt:Informationsector Korkeatekn: High--Tech Lahdessa asuvien työmatkojen jakautuminen pituusluokittain eri toimialoilla vuonna 1990 ja 2003 (alle 200 kilometrin työmatkat). Commuterstripssharebyfield of industry in 1990 and 2003
Features of peri-urbanarea of Helsinki Metropolitan Region Tripproduction Commutingarea Travel behaviour Location of activities Travel surveys Pedestrianzone Public transport zone Travel profile Home environment Car-orientedzone Urbanform Travel-relatedzones of urbanform Lowmobility
Populationdevelopment in inner and outerperi-urbanarea • Peri-Urbanisation • Peri-urbandevelopment is the mostrapidtype of landusechange in Europe • In Helsinki peri-urbanarea the urbansprawl is one of the strongest in Europe Public transport zone is almostnon-existing Share of population in car-orientedzones is 45 % Share of population in car-orientedzones is 36 %
Development of populationdensity in peri-urban areas InnerPeri-Urbanareaswithgoodrailconnection OuterPeri-Urbanareas inhabitants/hectare inhabitants/hectare
Travel behaviour in urban and peri-urbanareas Commutingarea Travel behaviour Location of activities Travel surveys Pedestrianzone Public transport zone Travel profile Home environment Car-orientedzone Urbanform Travel-relatedzones of urbanform Lowmobility
Daily mileage (passenger km) for inhabitants 0 5 10 15 20 25 30 35 40 45 50 passenger km/inhabitant, weekday pedestrian zone 6,6 2,6 1,5 fringe of pedestrian zone 8,5 3,4 1,7 Helsinki UrbanRegion pedestrian zone of subcentre 11,6 4,6 2,5 intensive public transport zone 10,6 5,2 2,1 public transport zone 14,4 4,5 1,8 car oriented zone 18,1 4,4 1,6 pedestrian zone InnerPeri-Urbanarea, 16,7 8,8 fringe of pedestrian zone 21,5 8,5 intensive public transport zone 20,7 1,6 6,6 goodrailconnection public transport zone 29,6 1,2 5,9 car oriented zone 23,9 6,4 outside densely populated area 31,2 1,7 6,0 pedestrian zone 26,9 5,2 fringe of pedestrian zone 28,9 3,2 Inner Peri- intensive public transport zone 24,9 5,4 Urbanarea public transport zone 23,3 3,6 car oriented zone 31,9 4,3 outside densely populated area 30,1 3,7 pedestrian zone 30,1 2,5 Outer Peri- fringe of pedestrian zone 33,2 public transport zone 31,3 4,5 Urbanarea car oriented zone 37,1 3,6 outside densely populated area 35,4 3,3 walk bicycle car bus train tram metro
The interactionbetweenpopulationdensity and daily passengercarmileage Outerperi-urbanarea Innerperi-urbanarea Innerperi-urbanarea & rail Helsinki urbanregion
Carbondioxideemissions of transport (g/inhabitants, weekday) 0 500 1 000 1 500 2 000 2 500 3 000 3 500 4 000 4 500 CO2 grams /inhabitant, weekday pedestrian zone 1 000 fringe of pedestrian zone 1 200 pedestrian zone of subcentre 1 600 Helsinki UrbanRegion intensive public transport zone 1 500 public transport zone 1 900 car oriented zone 2 200 pedestrian zone 2 000 InnerPeri-Urbanarea, fringe of pedestrian zone 2 500 intensive public transport zone 2 400 goodrailconnection public transport zone 3 300 car oriented zone 2 700 outside densely populated area 3 500 pedestrian zone 3 200 fringe of pedestrian zone Inner Peri- 3 300 intensive public transport zone 3 000 Urbanarea public transport zone 2 700 car oriented zone 3 600 outside densely populated area 3 400 pedestrian zone 3 300 Outer Peri- fringe of pedestrian zone 3 600 public transport zone Urbanarea 3 600 car oriented zone 4 200 outside densely populated area 4 000