Download

1 / 10
100 likes | 251 Vues
When Kidneys Go Bad: Kidney Dialysis. Research by Kristen McAlpine & Emily Norvell Mentored by Eric Mock and Tricia Lytton. Things to Know. Calibration A way to get data in a desired format from a related source

E N D
When Kidneys Go Bad: Kidney Dialysis Research by Kristen McAlpine & Emily Norvell Mentored by Eric Mock and Tricia Lytton
Things to Know • Calibration • A way to get data in a desired format from a related source • We found concentration by measuring the conductivity at known concentrations to create a formula for each salt • Concentration • How much of an object is in a specific volume • PPM • Stands for parts per million. Measures concentration • Conductivity • Relates to the electric charge created by salt ions in water
Micromhos • The unit for conductivity • Equilibrium • When ions are diffusing back and forth through the membrane at the same rate • “Blood” • A solution of water and a salt compound either potassium chloride or potassium acetate • “Dialysis Fluid” • Deionized water
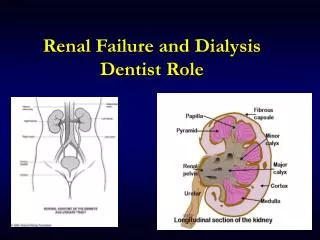
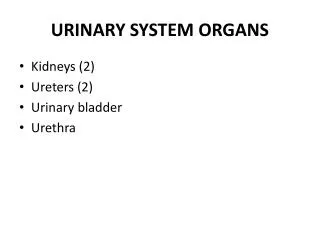
About the Kidneys • In normal body conditions the kidneys: • Removes wastes • Removes high concentration of normal components • Regulates chemical balance • Secrete hormones
Artificial Kidneys • Blood runs through membranes • Dialysis fluid runs counter flow • Diffuse out toxins • Blood recycles • New Dialysis fluid
Clean Blood Clean Dialysis Fluid Dirty Dialysis Fluid Dirty Blood
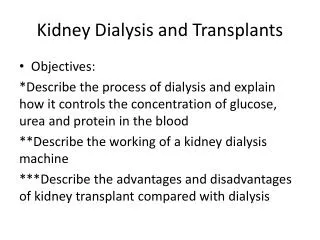
Objective • To experiment with different conditions • Flow rate • Different size toxins • Changing flow rates during dialysis • To find the most successful conditions that • Clean the blood the fastest • Clean the blood the most thoroughly
Procedure • Red-with our smaller salt we ran the dialysis fluid slower than the blood • Dark Red- we ran the same salt faster than the blood • Purple – We increased the number that we increased the flow rate by two more every minute, up to 480, which is where the pump could not go any higher • Light Blue – We changed the “toxin” to a salt that has a larger ion attached to it • Dark Blue – With the larger toxin, we added 250 PPM to the dialysis fluid, to reach equilibrium sooner.
Results • Red – The salt concentration dropped quickly at the beginning, but slowed down drastically. • Dark Red – This one dropped the fastest and ended sooner than the red. • Purple – This was more linear, making it more successful at minimizing shock and time. • Light Blue – At the same speed of the smaller salt, this one took longer for the concentration to drop. • Dark Blue – This data is not very accurate due to an obstructed tube in the beginning and a faulty conductivity probe. The line starts to taper off as it reaches equilibrium at 250 PPM.
Conclusion • The smaller toxin passed through the membrane faster • Increasing the dialysis flow rate by a growing amount creates a more linear graph • A linear decrease in salt is the most effective • The faster the dialysis fluid flow rate the less concentration of toxins over time • Toxins in the dialysis fluid causes the blood to stop at that concentration