Download
1 / 25
250 likes | 355 Vues
High Precision Spectroscopy of CH 5 + with NICE-OHVMS. James N. Hodges , Adam J. Perry and Benjamin J. McCall . Outline. Motivation CH 5 + Experimental Challenges Current Data Future Direction. Infrared Spectroscopy of CH 5 +. First Observed in 1999 by White , Tang & Oka

E N D
High Precision Spectroscopy of CH5+ with NICE-OHVMS James N. Hodges, Adam J. Perry and Benjamin J. McCall
Outline • Motivation CH5+ • Experimental Challenges • Current Data • Future Direction
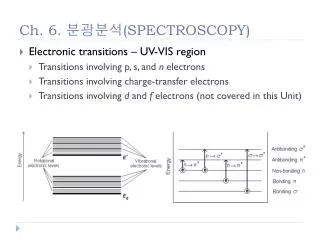
Infrared Spectroscopy of CH5+ • First Observed in 1999 by White , Tang & Oka • Observed by Velocity Modulation Spectroscopy • To this day remains completely unassigned Above: CH5+ Right: Infrared Spectrum of CH5+. E.T. White, J. Tang & T. Oka. Science, 284, 135 (1999).
Infrared Spectroscopy of CH5+ • 917 Lines Observed • Assignment by Subtraction • Removed the spectrum of other species: H3+, CH3+, C2H3+, HCO+, HCNH+, CH4and Rydberg H2 E.T. White, J. Tang & T. Oka. Science, 284, 135 (1999).
Potential Energy Surface • The potential energy surface • 120 mimina of Cs(I) • 120 Cs(II) saddlepoints ~ 40 cm-1 above minimum • 60 C2vsaddlepoints ~ 300 cm-1 above minimum Cs(I) Cs(II) C2V E.T. White, J. Tang & T. Oka. Science, 284, 135 (1999). X. Wang & T. Carrington Jr. J. Chem. Phys., 129, 234102 (2008).
Potential Energy Surface Zero Point Energy 10917 cm-1 ~ 300 cm-1 ~ 40 cm-1 E.T. White, J. Tang & T. Oka. Science, 284, 135 (1999). X. Wang & T. Carrington Jr. J. Chem. Phys., 129, 234102 (2008).
Instrumental Layout ni = np - ns I P S OPO Freq. Comb AOM 90o Phase Shift Wave-meter 40 kHz Plasma Frequency 2f Lock-In Amplifier EOM Lock-In Amplifier 80 MHz 1 × Cavity FSR YDFL X & Y Signal X & Y Signal K. N. Crabtree, et al. Chem. Phys. Lett. (2012), 551, 1-6.
Comb Calibration Freq. Comb AOM Wave-meter […] Signal Pump
Comb Calibration Freq. Comb AOM Wave-meter […] Signal Pump
Comb Calibration Freq. Comb AOM Wave-meter […] Signal Signal Pump
Production of CH5+ • Velocity modulated, l-N2 cooled, positive column • H3+ + CH4 CH5+ + H2 • Low current: ~ 80 mA • 6 kHz modulation frequency • Ratio 50:1 H2:CH4 • Total pressure ~ 1 Torr E.T. White, J. Tang & T. Oka. Science, 284, 135 (1999).
Technical Challenges • Lower modulation frequency lower current • Lower frequency greater noise • Higher frequencies lower pressures
Technical Challenges High current (40 kHz) Low current (6 kHz) No Plasma
Last Year’s Line S/N ~ 25 Wavenumber (cm-1)
Improvements • Baked Mirrors • Operating in dry purge box • Prevented rapid degradation of performance
Improvements • Included a -emitter • 63Ni • Less plasma noise in lock • Attain lower current
Recent Work CH5+ line @ 2898 cm-1. Approximately 0.5 Intensity as Oka’s line @ 2926 cm-1 . S/N ~ 30
Future Outlook • New Mirrors • Have specialized coating • Improved Performance Lamb dips • Complete 917 lines • 4-line combination differences with complete data set.
Acknowledgements Springborn Fellowship NSF GRF (DGE 11-44245 FLLW)