Download
1 / 58
620 likes | 1.09k Vues
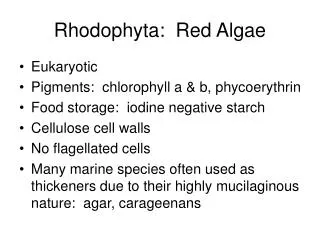
Energy in Marine Ecosystems: Marine Food Chains. Begins with the primary producer s They are autotrophs (‘self’-‘feeders’ ) - Organism capable of making organic compounds,

E N D
Energy in Marine Ecosystems:Marine Food Chains Begins with the primaryproducers They are autotrophs (‘self’-‘feeders’) - Organism capable of making organic compounds, Photoautotrophs, such as plants,use solar energy to help make these compounds in a process known as photosynthesis.
Primary producers are consumed by primaryconsumers • Primary consumers , are heterotrophs(‘other’-‘feeders’)- Organisms incapable of making organic compounds from inorganic material, they obtain their nutrition by consuming autotrophs and derive energy through respiration. • Primary consumers are consumed by secondary consumers, a.k.a. tertiaryproducers. • And so on…Food chains vary in length.
Capture and Flow of Energy The flow of energy through living systems. © 2002 Brooks/Cole, a division of Thomson Learning, Inc.
The Cycling of Matter The cycling of matter through living systems. © 2002 Brooks/Cole, a division of Thomson Learning, Inc.
Food Chains • Food Chain- Energy and matter move from one organism to another as each eats a lower member and, in turn, is eaten by a higher member
Trophic Levels • Each ‘link’ in the food chain is called a trophic level. (troph means food) • 1st =Primary Producer • Ex: plants, algae • 2nd = Primary Consumer • Ex: Grazer, herbivores • 3rd = Secondary Consumer • Ex: Carnivores • 4th = Tertiary Consumer, etc… • At each level, detrivores and decomposers are turning biomass into nutrients
Food Web • Because organisms consume at various trophic levels, it is really more like a web, not a chain.
Antarctic Ocean Food Web Diatoms, and other primary producers, convert the energy from the sun into food used by the rest of the oceanic community. © 2002 Brooks/Cole, a division of Thomson Learning, Inc.
Ecological Efficiency and Ecological Pyramids • About 90% of biomass is lost when transferred from between trophic levels • Ecological efficiency= 10% • As trophic levels increase, biomass decreases • Why there are more squirrels than wolves in the world
Ecological Pyramid 3° Cons. 1 g 2° Consumers 10 g Primary Consumers 100 g Primary Producers 1000 g Biomass
Feeding Relationships © 2002 Brooks/Cole, a division of Thomson Learning, Inc.
Primary Productivity Oceanic productivity is measured in gC/ m2/yr. © 2002 Brooks/Cole, a division of Thomson Learning, Inc.
Continental Shelf Richest part of the ocean, with the world's most important fishing grounds Extends from the subtidal to the shelf break, the outer edge of the continental shelf where depths drastically increase The average depth is around 150 m Varies in width from less than 1 km to over 750 km.
Important characteristics to organisms • Relatively shallow • Temps vary more here than in the deeper ocean • Affected by waves, currents and storms • Tides can cause particularly strong tidal currents • Wind waves can affect to 200m • Turbulence prevents stratification • Therefore more productive than the open ocean • Close to land • Rivers discharge into this zone of the ocean, bringing nutrients, phytoplankton and sediment • These combine to make the water murkier than farther offshore. Murkier water means light doesn't penetrate as deeply, reducing the euphotic zone depth.
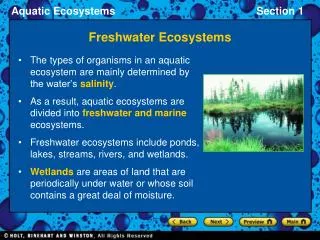
The Epipelagic The pelagic realm of the ocean describes the vast, open ocean. The epipelagic realm is the upper part of this environment. Depths only to about 200m Corresponds to the depth of the euphotic zone Euphotic depth the depth below which where there is no longer enough light for organisms to grow. Divided into coastal, or neritic waters that lie over the continental shelf, and oceanic waters.