Download
1 / 70
730 likes | 1.03k Vues
1. WHAT IS ECONOMICS?. After studying this chapter, you will be able to:. Define economics and distinguish between microeconomics and macroeconomics Explain the two big questions of economics Explain the key ideas that define the economic way of thinking

E N D
1 WHAT IS ECONOMICS?
After studying this chapter, you will be able to: • Define economics and distinguish between microeconomics and macroeconomics • Explain the two big questions of economics • Explain the key ideas that define the economic way of thinking • Explain how economists go about their work as social scientists and policy advisers
Is economics about money: How people make it and spend it? Is it about business, government, and jobs? Is economics about why some people and some nations are rich and others poor? Economics is about all these things, but its core is the study of choices and their consequences. Your life will be shaped by the challenges you face and the opportunities that you create. But to face those challenges and seize the opportunities, you must understand the powerful forces at play. The economics that you’re about to learn will become your most reliable guide.
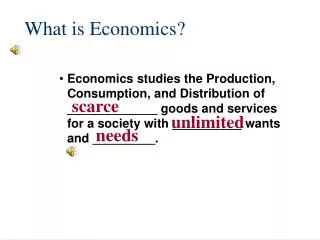
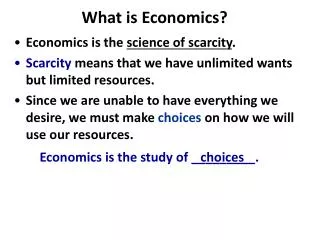
Definition of Economics • All economic questions arise because we want more than we can get. • Our inability to satisfy all our wants is called scarcity. • Because we face scarcity, we must make choices. • The choices we make depend on the incentives we face. • An incentive is a reward that encourages an action or a penalty that discourages an action.
Definition of Economics • Economics is the social science that studies the choices that individuals, businesses, governments, and entire societies make as they cope with scarcity and the incentives that influence and reconcile those choices. • Economics divides in two main parts: • Microeconomics • Macroeconomics
Definition of Economics • Microeconomics is the study of choices that individuals and businesses make, the way those choices interact in markets, and the influence of governments. • An example of a microeconomic question is: Why are people buying more e-books and fewer hard copy books? • Macroeconomics is the study of the performance of the national and global economies. • An example of a macroeconomic question is: Why is the unemployment rate in the United States so high?
Two Big Economic Questions • Two big questions summarize the scope of economics: • How do choices end up determining what, how, and for whom goods and services get produced? • When do choices made in the pursuit of self-interest also promote the social interest?
Two Big Economic Questions • What, How, and For Whom? • Goods and services are the objects that people value and produce to satisfy human wants. • What? • Agriculture accounts for less than 1 percent of total U.S. production, manufactured goods for 22 percent, and services for 77 percent. • In China, agriculture accounts for 11 percent of total production, manufactured goods for 47 percent, and services for 43 percent.
Two Big Economic Questions • Figure 1.1 shows these numbers for the United States and China. • It also shows the numbers for Brazil. • What determines these patterns of production? • How do choices end up determining the quantity of each item produced in the United States and around the world?
Two Big Economic Questions • How? • Goods and services are produced by using productive resources that economists call factors of production. • Factors of production are grouped into four categories: • Land • Labor • Capital • Entrepreneurship
Two Big Economic Questions • The “gifts of nature” that we use to produce goods and services are land. • The work time and work effort that people devote to producing goods and services is labor. • The quality of labor depends on human capital, which is the knowledge and skill that people obtain from education, on-the-job training, and work experience. • The tools, instruments, machines, buildings, and other constructions that businesses use to produce goods and services are capital. • The human resource that organizes land, labor, and capital is entrepreneurship.
Two Big Economic Questions • Figure 1.2 shows a measure of the growth of human capital in the United States over the last century—the percentage of the population that has completed different levels of education. • Economics explains these trends.
Two Big Economic Questions • For Whom? • Who gets the goods and services depends on the incomes that people earn. • Land earns rent. • Labor earns wages. • Capital earns interest. • Entrepreneurship earns profit.
Two Big Economic Questions • Does the Pursuit of Self-Interest Unintentionally Promote the Social Interest? • Every day, 314 million Americans and 6.9 billion people in other countries make economic choices that result in What, How, and For Whom goods and services are produced. • These choices are made by people who are pursuing their self-interest. • Are they promoting the social interest?
Two Big Economic Questions • Self-Interest • You make choices that are in your self-interest—choices that you think are best for you. • Social Interest • Choices that are best for society as a whole are said to be in the social interest. • Social interest has two dimensions: • Efficiency • Equity
Two Big Economic Questions • Efficiency and Social Interest • Resource use is efficient if it is not possible to make someone better off without making someone else worse off. • Equity is fairness, but economists have a variety of views about what is fair. • Fair Shares and Social Interest • The idea that the social interest requires “fair shares” is a deeply held one. • But what is fair?
Two Big Economic Questions • Four topics that generate discussion and that illustrate tension between self-interest and social interest are: • Globalization • The information-age monopolies • Climate change • Economic instability
Two Big Economic Questions • Globalization • Globalization means the expansion of international trade, borrowing and lending, and investment. • Globalization is in the self-interest of consumers who buy low-cost imported goods and services. • Globalization is also in the self-interest of the multinational firms that produce in low-cost regions and sell in high-price regions. • But is globalization in the self-interest of low-wage workers in other countries and U.S. firms that can’t compete with low-cost imports? • Is globalization in the social interest?
Two Big Economic Questions • The Information-Age Monopolies • The technological change of the past forty years has been called the Information Revolution. • The information revolution has clearly served your self-interest: It has provided your cell-phone, laptop, loads of handy applications, and the Internet. • It has also served the self-interest of Bill Gates of Microsoft and Gordon Moore of Intel, both of whom have seen their wealth soar. • But did the information revolution serve the social interest?
Two Big Economic Questions • Climate Change • Climate change is a huge political issue today. • Every serious political leader is acutely aware of the problem and of the popularity of having proposals that might lower carbon emissions. • Burning fossil fuels to generate electricity and to power airplanes, automobiles, and trucks pours a staggering 28 billion tons—4 tons per person—of carbon dioxide into the atmosphere each year.
Two Big Economic Questions • Two thirds of the world’s carbon emissions comes from the United States, China, the European Union, Russia, and India. • The fastest growing emissions are coming from India and China. • The amount of global warming caused by economic activity and its effects are uncertain, but the emissions continue to grow and pose huge risks.
Two Big Economic Questions • Every day, when you make self-interested choices to use electricity and gasoline, you contribute to carbon emissions. • You leave your carbon footprint. • You can lessen your carbon footprint by walking, riding a bike, taking a cold shower, or planting a tree. • But can each one of us be relied upon to make decisions that affect the Earth’s carbon-dioxide concentration in the social interest? • Can governments change the incentives we face so that our self-interested choices are also in the social interest?
Two Big Economic Questions • Economic Instability • Between 1993 and 2007, the U.S. and global economies expanded strongly. Incomes in the United States increased by 30 percent and incomes in China tripled. • But in August 2007, a period of financial stress began that soon gripped the entire global financial system. • The choices of banks to borrow and lend and the choices of people and businesses to lend to and borrow from banks are made in self-interest. • Does this lending and borrowing serve the social interest?
The Economic Way of Thinking • Six key ideas define the economic way of thinking: • A choice is a tradeoff. • People make rational choices by comparing benefits and costs. • Benefit is what you gain from something. • Cost is what you must give up to get something. • Most choices are “how-much” choices made at the margin. • Choices respond to incentives.
The Economic Way of Thinking • A Choice Is a Tradeoff • The economic way of thinking places scarcity and its implication, choice, at center stage. • You can think about every choice as a tradeoff—an exchange—giving up one thing to get something else. • On Saturday night, will you study or have fun? • You can’t study and have fun at the same time, so you must make a choice. • Whatever you choose, you could have chosen something else. Your choice is a tradeoff.
The Economic Way of Thinking • Making a Rational Choice • A rational choice is one that compares costs and benefits and achieves the greatest benefit over cost for the person making the choice. • Only the wants of the person making a choice are relevant to determine its rationality. • The idea of rational choice provides an answer to the first question: What goods and services will be produced and in what quantities? • The answer is: Those that people rationally choose to buy!
The Economic Way of Thinking • How do people choose rationally? • The answers turn on benefits and costs. • Benefit: What you Gain • The benefit of something is the gain or pleasure that it brings and is determined by preferences • Preferences are what a person likes and dislikes and the intensity of those feelings.
The Economic Way of Thinking • Cost: What you Must Give Up • The opportunity cost of something is the highest-valued alternative that must be given up to get it. • What is your opportunity cost of going to a live concert? • Opportunity cost has two components: • 1. The things you can’t afford to buy if you purchase the concert ticket. • 2. The things you can’t do with your time if you attend the concert.
The Economic Way of Thinking • How Much? Choosing at the Margin • You can allocate the next hour between studying and instant messaging your friends. • The choice is not all or nothing, but you must decide how many minutes to allocate to each activity. • To make this decision, you compare the benefit of a little bit more study time with its cost—you make your choice at the margin.
The Economic Way of Thinking • To make a choice at themargin, you evaluate the consequences of making incremental changes in the use of your time. • The benefit from pursuing an incremental increase in an activity is its marginal benefit. • The opportunity cost of pursuing an incremental increase in an activity is its marginal cost. • If the marginal benefit from an incremental increase in an activity exceeds its marginal cost, your rational choice is to do more of that activity.
The Economic Way of Thinking • Choices Respond to Incentives • A change in marginal cost or a change in marginal benefit changes the incentives that we face and leads us to change our choice. • The central idea of economics is that we can predict how choices will change by looking at changes in incentives. • Incentives are also the key to reconciling self-interest and the social interest.
Economics: A Social Science and Policy Tool • Economist as Social Scientist • Economists distinguish between two types of statement: • Positive statements • Normative statements • A positive statement can be tested by checking it against facts. • A normative statement expresses an opinion and cannot be tested.
Economics: A Social Science and Policy Tool • Unscrambling Cause and Effect • The task of economic science is to discover positive statements that are consistent with what we observe in the world and that enable us to understand how the economic world works. • Economists create and test economic models. • An economic model is a description of some aspect of the economic world that includes only those features that are needed for the purpose at hand.
Economics: A Social Science and Policy Tool • A model is tested by comparing its predictions with the facts. • But testing an economic model is difficult, so economists also use • Natural experiments • Statistical investigations • Economic experiments
Economics: A Social Science and Policy Tool • Economist as Policy Adviser • Economics is a toolkit for advising governments and businesses and for making personal decisions. • All the policy questions on which economists provide advice involve a blend of the positive and the normative. • Economics can’t help with the normative part—the goal. • But for a given goal, economics provides a method of evaluating alternative solutions—comparing marginal benefits and marginal costs.
After studying this appendix, you will be able to: • Make and interpret a scatter diagram • Identify linear and nonlinear relationships and relationships that have a maximum and a minimum • Define and calculate the slope of a line • Graph relationships among more than two variables
Graphing Data • A graph reveals a relationship. • A graph represents “quantity” as a distance. • A two-variable graph uses two perpendicular scale lines. • The vertical line is the y-axis. • The horizontal line is the x-axis. • The zero point in common to both axes is the origin.
Graphing Data • Economists measure variables that describe what, how, and for whom goods and services are produced. • These variables are quantities produced and prices. • Figure A1.2 shows two examples of economic graphs.
Graphing Data • Figure A1.2(a) is a graph about song downloads in 2010. • Point A tells us what the quantity and price were. • You can “read” this graph as telling you that in 2010: • 8.3 million songs a day were downloaded at an average price of $1.37 per song.
Graphing Data Figure A1.2(b) is a graph about song and album downloads in 2010. Point A tells us what these quantities were. You can “read” this graph as telling you that in 2010, 3.8 million songs and 0.2 million albums a day were downloaded.
Graphing Data • Scatter Diagrams • A scatter diagram plots the value of one variable against the value of another variable for a number of different values of each variable. • A scatter diagram reveals whether a relationship exists between the two variables. • Figure A1.3 (on the next slide) shows some data on box office tickets sold and the number of DVDs sold for nine of the most popular movies in 2011. • The table gives the data and the graph describes the relationship between box office tickets sold and DVD sales.
Graphing Data • Point A tells us that Fast Five sold 27 million tickets at the box office and 2 million DVDs. • The points reveal that there is a tendency for larger box office sales to bring greater DVD sales. ... • But you couldn’t predict how many DVDs a movie would sell just by knowing its box office sales.
Graphing Data Figure A1.4(a) is a scatter diagram of income and expenditure, on average, during a ten-year period. Point A shows that in 2006, income was $33,000 and expenditure was $31,000. The graph shows that as income increases, so does expenditure, and the relationship is a close one.
Graphing Data Figure A1.4(b) is a scatter diagram of inflation and unemployment in the United States from 2001 through 2011. The points show no relationship between the two variables. But 2010 had a high unemployment rate and a low inflation rate.
Graphs used in Economic Models • Graphs are used in economic models to show the relationship between variables. • The patterns to look for in graphs are the four cases in which • Variables move in the same direction. • Variables move in opposite directions. • Variables have a maximum or a minimum. • Variables are unrelated.
Graphs used in Economic Models • Variables That Move in the Same Direction • A relationship between two variables that move in the same direction is called a positive relationship or a direct relationship. • A line that slopes upward shows a positive relationship. • A relationship shown by a straight line is called a linear relationship. • The three graphs on the next slide show positive relationships.