Exponential Functions Analysis: March 3, 2014
This resource discusses identifying exponential functions, graphing y = 2^x, determining domain and range, and recognizing growth or decay. Includes step-by-step instructions & solutions.

Exponential Functions Analysis: March 3, 2014
E N D
Presentation Transcript
Exponential Decay March 3, 2014 Pages 531-534
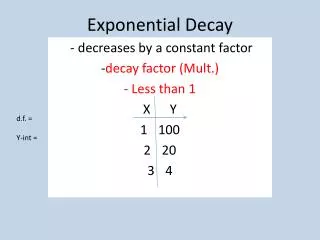
1. +1 +1 +1 x –1 0 1 2 1 1 y 1 3 9 3 3 3 3 Tell whether the table represents an exponential function. The y-values are multiplied by 3 for each increase of 1 in x, so the table represents an exponential function.
2. +1 +1 +1 x –1 0 1 2 y 4 1 1 1 1 1 1 1 4 4 4 4 4 The y-values are multiplied by for each increase of 1 in x, so the table represents an exponential function. 1 16 Tell whether the table represents an exponential function.
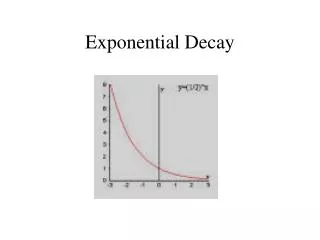
3. Graph the function y = xand identify its domain and range. 1 2 x – 2 – 1 0 1 2 y STEP1 Make a table by choosing values for x of -2, -1, 0, 1, and 2. STEP 2 Using a graphing calculator, put in the exponential function, y = 2x.
x x – 2 – 2 – 1 – 1 0 0 1 1 2 2 1 1 1 1 y y 4 4 2 2 1 1 2 2 4 4 STEP 3 View the table to find the values of y. STEP 4 Identify its domain and range. Domain: Range:
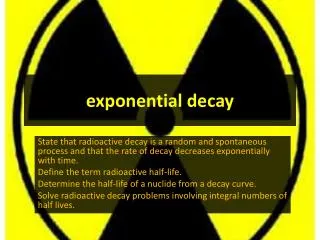
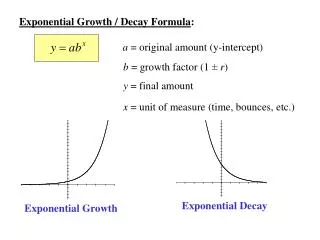
4. Tell whether the graph represents exponential growth or exponential decay. SOLUTION The graph represents exponential growth.
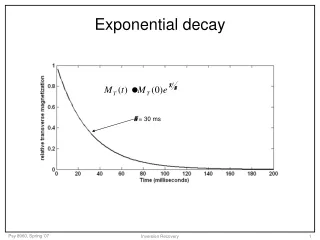
5. Tell whether the graph represents exponential growth or exponential decay. SOLUTION The graph represents exponential decay.
HOMEWORK Worksheet