Download
1 / 46
460 likes | 601 Vues
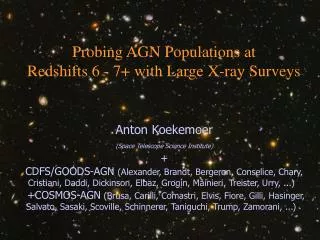
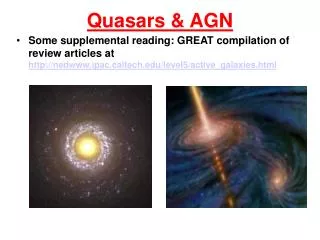
AGN Surveys. Phil Outram University of Durham 17 th February 2005. Cen A. Type I Type II. Can observe many different types of AGN in many different wavebands However, time is short… So I’ll focus on optically-selected QSO (Luminous Type I AGN) surveys.

E N D
AGN Surveys Phil Outram University of Durham 17th February 2005
Cen A Type I Type II Can observe many different types of AGN in many different wavebands However, time is short… So I’ll focus on optically-selected QSO (Luminous Type I AGN) surveys
QSOs and Galaxy Formation Studying QSOs Probes: • Accretion history of BHs in the Universe (S. White) • Relation of BH growth and galaxy evolution • Large Scale Structure Cosmology • State of intergalactic medium • History of reionization In this talk I will outline some of the main results from the 2dF & SDSS surveys…
QSO Surveys in the last decade • 1996: Veron-Veron catalogue • 8609 QSOs • 2833 AGNs • 2dF QSO survey (1997 – 2002) • 25,000 QSOs at z<3 • SDSS QSO survey (1999 – 2005+) • Currently: >50,000 QSOs • Goal: 100,000 QSOs • z<6.5
Selecting QSOs • QSO candidates selected from multiband optical images • Identity confirmed (+ redshift measured) by spectroscopy • At z<2.5 QSOs typically blue stellar objects • Main contaminants include stars (inc. WDs) + NL galaxies • At low z, host galaxy may make QSO appear extended/redder • z>2.5 Ly forest makes QSO redder • 2.5<z<3 QSO colour similar to main sequence stars • Intrinsically reddened / ‘buried’ QSOs may be missed • Trade-off between COMPLETENESS & EFFICIENCY
3 Lya 2 CIV CIII MgII 1 OIII 0 4000 Åobserved wavelength8000 Å redshift
Properties of 2QZ • QSOs selected from stellar sources using U-B:B-R colours • 0.3<z<2.5 • ~23000 B<21 QSOs in final catalogue • Volume probed ~4 x10⁹h-3Mpc3 www.2dfquasar.org Croom et al. 2002, MNRAS, 322, L29 Croom et al. 2004, MNRAS, 349, 1397
The SDSS QSO Survey NGP SGP QSOs selected from imaging in 5 wavebands – u g r i z Multi-colour selection Sensitive to QSOs at high redshift (z<6.5) Currently ~50000 QSOs in DR3 i<19 (main sample) i<20 (high-z sample) Schneider et al. 2003, AJ, 126, 2579 www.sdss.org
Evolution of Quasar Luminosity Function Strong evolution in luminosity density is seen back to z~2. At z>3 the observed space density of QSOs declines. Exponential decline of quasar density at high redshift, different from normal galaxies SFR of Normal Gal
Evolution of LF shape PLE PDE
At low-z: LF is well fit by double power law with pure luminosity evolution PLE A single population of rare, long-lived QSOs? At z~4: quasar luminosity function much FLATTERthan LF at z~2
COMBO-17 Due to the relatively bright magnitude limits of the SDSS and 2QZ surveys, the LF analysis is restricted to relatively bright QSOs – especially at high redshift. What about fainter QSOs? 2SLAQ survey extending 2QZ a magnitude deeper:~10000 g<21.85 QSOs on the way… Photometric selection of 192 1.2<z<4.8 QSOs using COMBO-17, reaching R~24 Wolf et al. (2003)
The evolving LF can be adequately described by either PLE (dashed line) or PDE (solid line) – largely due to the absence of an obvious break
QSO Clustering • Do QSOs trace: • the large scale structure of dark matter, • the distribution of normal galaxies, or, • justthe most overdense regions (a highly-biased distribution)? • We can answer this question by determining the amplitude of QSO clustering • The 2-Point Correlation Function Croom et al. 2004
Redshift Evolution 2dF Fan et al. Croom et al. 2004 Decreasing bias upper limit to lifetime of QSOs ≲ 6x10⁸ years at z~2
2dF QSO clustering amplitude at fixed z vs MB(Loaring et al. in prep)
BLR Emission Line Widths Measure v & apply virial theorem: MBH ~ R v 2 Assume: R ~ L 0.68 - observed locally (Netzer 2002) where R is the BLR radius. MBH ~ v 2 L 0.68 Line widths MBH ~ L0.93 Corbett et al 2003, MNRAS, 343, 705
Assuming that radius-Luminosity relation independent of z then can derive M/L evolution: Little evolution in M/L seen This also does not agree with PLE Caveat… Large L (R) evolution seen, but what if R ~ M not L??
Evolution in BH mass function McLure & Dunlop 2003 QSO BH masses appear to drop towards lower redshift! (“Downsizing”) However… Direct imaging host galaxies do not appear any larger at high redshift (e.g. Croom et al 2004)
Understanding QSOs: summary of evidence so far… Locally: QSOs cluster like average galaxies z~2: higher clustering amplitude + MUCH more luminous / numerous Little correlation between luminosity / clustering amplitude QSOs seen out to z>6 LF well described by PLE QSO BH mass as z? BHs seen in ALL bulges – tight correlation: Possible scenario… In hierarchical galaxy merging paradigm - all major galaxies have short-lived QSO phase: QSO lit up when gas funnelled into galaxy centre after merger QSO stage when halo has mass ~ 1012-13 Mסּ ~ constant with z Fewer mergers, less gas around now – fewer, lower L QSOs Semi-Analytic models
On to cosmology…The 2QZ Power Spectrum Need to assume cosmology to derive r from z Power spectra convolved with survey window functions Outram et al. 2003, MNRAS, 342, 483
Comparison with models Fitting model CDM P(k) Mock QSO P(k) from Hubble Volume ΛCDM N-body simulation Ωmh=0.19±0.05 Ωb/Ωm=0.18±0.10
Redshift-space Distortions in the QSO Power Spectrum Outram et al. 2001, MNRAS, 328, 174
z-space distortion effect of cosmology / infall degenerate… However, we have a second constraint on the bias (and hence infall) from the correlation function analysis Ωm=1-ΩΛ=0.29 β=0.45 +0.17 -0.09 +0.09 -0.11 An EdS cosmology is rejected at over 95% confidence. Outram et al. 2004, MNRAS, 348, 745
Cross-correlation of QSOs with foreground galaxies Myers et al. 2005, submitted Gaztanaga, 2003, ApJ, 589, 82 Stronger signal seen than expected!
The Ly Forest Power Spectrum Optical depth fluctuations in observed spectra monotonically mapped onto a Gaussian density field. Bias-free linear P(k) estimate at 2<z<5 McDonald et al. (2004) 3000 SDSS spectra
Kim et al. (2004) – LUQAS QSOs from UVES - 27 high-resolution QSO spectra Large uncertainty in normalization due to uncertainty in continuum & hence optical depth – especially in low resolution spectra.
The Highest Redshift QSOs • z>4: ~700 known • z>5: ~30 • z>6: 7 • SDSS i-dropout Survey: • By Spring 2004: 6000 deg2 at zAB<20 • Fourteen luminous quasars at z>5.7 • 20 – 40 at z~6 expected in the whole survey Total Discoveries SDSS Discoveries
Constraining the Reionization Epoch • Neutral hydrogen fraction • Volume-averaged HI fraction increased by >100 from z~3 to z~6 • Mass-averaged HI fraction > 1% • At z~6: • Last remaining neutral regions are being ionized • The universe is >1% neutral The end of reionization epoch?? mass ave. vol. ave Fan et al. in prep
QSOs and Galaxy Formation Studying QSOs Probes: • Accretion history of BHs in the Universe • Relation of BH growth and galaxy evolution • Large Scale Structure Cosmology • State of intergalactic medium • History of reionization