Download
1 / 14
160 likes | 524 Vues
Barriers to Service Innovation and How to Overcome Them . John Goodman, Vice Chairman, TARP Bentley University June 18, 2009. About TARP. Founded in 1971—38 years delivering dramatic impact White House sponsored studies of client service (instigated 800#s)

E N D
Barriers to Service Innovation and How to Overcome Them John Goodman, Vice Chairman, TARP Bentley University June 18, 2009
About TARP • Founded in 1971—38 years delivering dramatic impact • White House sponsored studies of client service (instigated 800#s) • Malcolm Baldrige (influenced criteria) • Assisted 6 Baldrige winners and 43 Fortune 100 companies • Initiated concept of “word of mouth” (TARP/Coca-Cola 1978 Study) and “word of mouse” (eCare and Click & Mortar studies 1999) • Credited with developing approach for quantification of impact of service and quality on revenue for companies like Neiman Marcus, Mayo HS, IBM, American Express, Qualcomm, Honda, Chick-Fil-A, Toyota/Lexus, USAA, Xerox, and Motorola • New book, Strategic Customer Service, published by American Management Association, May 2009.
MAXIMUM CUSTOMER SATISFACTION & LOYALTY EFFECTIVE CUSTOMER CONTACT MANAGEMENT DOINGTHE JOBRIGHT THE FIRST TIME + = Customers will: Buy again Buy more Tell others to buy Buy your other products & services Respond to Individual Customers Identify Sources of Dissatisfaction Improved Product & Service Quality Conduct Root Cause Analysis Feedback on Prevention Formula for Satisfaction & Brand Loyalty This presentation is the intellectual property of TARP Worldwide and for use only to illustrate TARP’s methodology. Use of or distribution beyond that purpose is forbidden.
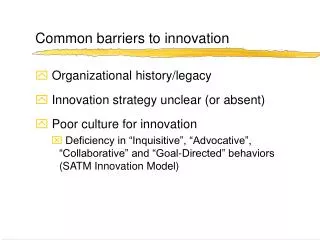
Barriers to Service Innovation • Misunderstanding of the causes of dissatisfaction • Assumption that no news is good news • Assumption that everyone is price driven • Demand for interactions that are consistent and delightful • Benchmarking that causes complacency • Single source Voice of the Customer • Financial and Marketing cynicism This presentation is the intellectual property of TARP Worldwide and for use only to illustrate TARP’s methodology. Use of or distribution beyond that purpose is forbidden.
Causes of Customer Dissatisfaction The majority of dissatisfaction is not caused by employee errors or attitude. Employee Customer 20%-30% 20% • - Wrong expectations • - Customer error • Fails to follow policy • Attitude • - Fails to follow policy Company 40%-60% • - Products and services don’t meet expectations • - Marketing miscommunication • - Broken processes • - Products and services don’t meet expectations • Marketing miscommunication • - System fails • - Units fail to coordinate This presentation is the intellectual property of TARP Worldwide and for use only to illustrate TARP’s methodology. Use of or distribution beyond that purpose is forbidden.
No News Is Not Good News: Health Care I Question/Problem Experience II Contact Behavior III Contact Handling IV Market Impact % Definitely/Probably Recommend/repurchase from same organization No problem experience 50% 90% Satisfied150% 93% Health Care Clients Complainers 5-25% Mollified230% 50% Problem experience 50% Dissatisfied3 20% 30% Non- Complainers 95-75% Experience suggests three strategies: Prevention, Solicitation of Complaints, and Response 60% 6 This presentation is the intellectual property of TARP Worldwide and for use only to illustrate TARP’s methodology. Use of or distribution beyond that purpose is forbidden.
Problems Raise Sensitivity to PriceProblems vs. Dissatisfaction with Price Percent of customer dissatisfied with fees rises with number of problems. % Dissatisfied with price or fees This presentation is the intellectual property of TARP Worldwide and for use only to illustrate TARP’s methodology. Use of or distribution beyond that purpose is forbidden.
Flexibility and Explanation Trump Consistency, Accessibility and Money • No Unpleasant Surprises • If Trouble Encountered • Accessibility • Taking Ownership • Apology • Tailored action – flexible response • Clear Explanation – so that I believe I have been treated fairly – often more important than money • Handle on First Contact Results in 10% Higher Satisfaction and 50% Lower Cost This presentation is the intellectual property of TARP Worldwide and for use only to illustrate TARP’s methodology. Use of or distribution beyond that purpose is forbidden.
Impact of Delightful Experience on Top-Box Loyalty by Type of Action This presentation is the intellectual property of TARP Worldwide and for use only to illustrate TARP’s methodology. Use of or distribution beyond that purpose is forbidden.
Traditional Views of Benchmarking and Voice of the Customer • Benchmarking of processes is good – benchmarking of performance is problematic • Performance is local • If tied to incentives – can be disheartening • Voice of the customer tends to be only surveys or fragmented • Surveys, contacts, internal operations and employees • Marketing and sales are usually not the focus of feedback This presentation is the intellectual property of TARP Worldwide and for use only to illustrate TARP’s methodology. Use of or distribution beyond that purpose is forbidden.
x x x X% Satisfied Almost all repurchasing 35 50% Complain Y% Mollified Some not repurchasing 153 10,000 Customers with problems Z% Dissatisfied Many not repurchasing 306 50% Do not complain Some not repurchasing 1500 1994 Total customers at risk Revenue Impact Of Service Can Be 20 X The Cost Impact = = = = = This presentation is the intellectual property of TARP Worldwide and for use only to illustrate TARP’s methodology. Use of or distribution beyond that purpose is forbidden.
x x 20% delighted Tell a few = 600 1,000 clients 80% satisfied Tell one = 800 1,400 1 Actions 30 Referrals = 47 New clients 1400 Referrals X Word of Mouth Impact Can be Estimated Example Calculation of Potential Impact This presentation is the intellectual property of TARP Worldwide and for use only to illustrate TARP’s methodology. Use of or distribution beyond that purpose is forbidden.
Ten Myths About Service 1. Always exceed customer expectations 2. Answering the phone really fast is the key to success 3. People always prefer talking to people 4. The customer is always right 5. Complaints are down, things are getting better 6. Employees are the cause of most dissatisfaction 7. Price and cost cutting is the key to success 8. We’re at 90% satisfaction – let’s declare victory! 9. Measure Net Promoter and we’re done 10. We have a 100% satisfaction guarantee – everyone is happy. This presentation is the intellectual property of TARP Worldwide and for use only to illustrate TARP’s methodology. Use of or distribution beyond that purpose is forbidden.
Contact Information for Papers Mentioned • John Goodman • jgoodman@tarp.com • (703) 284-9253