Download
1 / 48
510 likes | 855 Vues
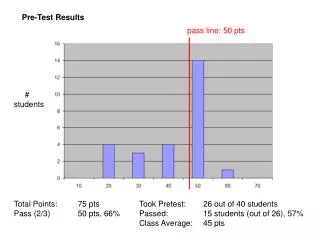
Pre-analytical factors that can affect coag test results. Underfilled tube High hematocrit Hemolysis Traumatic blood draw (tissue factor) Delay in testing Excessive agitation of blood in tube (platelet tests). The Prothrombin Time. Thromboplastin: Tissue factor Phospholipid Calcium.

E N D
Pre-analytical factors that can affect coag test results • Underfilled tube • High hematocrit • Hemolysis • Traumatic blood draw (tissue factor) • Delay in testing • Excessive agitation of blood in tube (platelet tests)
The Prothrombin Time Thromboplastin: Tissue factor Phospholipid Calcium Add thromboplastin (excess of tissue factor + phospholipid + calcium) to citrated plasma. Not sensitive to XI, IX, VIII levels More sensitive than aPTT to warfarin effect Usually expressed as International Normalized Ratio (INR)
ISI ( ) Patient PT Mean Normal PT INR = ISI (International Sensitivity Index) is reagent- and method-specific; higher number indicates lower sensitivity to changes in clotting factor levels
Reagent A: ISI = 1.24, mean normal = 12.6 sec PT = 22 sec 1.24 ) ( 22.0 12.6 INR = = 2.0 Reagent B: ISI = 2.46, mean normal = 12.2 sec PT = 16.2 sec 2.46 ) ( 16.2 12.2 INR = = 2.0
INR values with two different reagentsPatients on warfarin REAGENT E (ISI 2.98) REAGENT B (ISI 0.96) PATIENT # INR INR 1 3.4 2.7 2 2.8 2.5 3 3.5 2.3 4 2.6 2 5 2.2 1.2 6 2.3 2.4 7 1.9 1.7 8 3 2.8 9 2.2 2.7 10 4 4
INTERPRETING A LONG PT/INR • If aPTT normal • Factor VII deficiency • Mild deficiency of factors in common pathway (warfarin, vit K deficiency etc) • If aPTT long: • Liver disease • Vitamin K deficiency • Warfarin • DIC • High level of heparin • Inhibitor affecting common pathway (eg, direct thrombin or Xa inhibitor) • Isolated deficiency of X, V, II, fibrinogen (rare)
Activated partial thromboplastin time (aPTT) Incubate citrated plasma with phospholipid + activator (generates XIIa→XIa→IXa). Then add calcium to allow clotting to proceed to completion. Not sensitive to VII level. More sensitive to heparin than PT “Partial thromboplastin” Phospholipid + Activator (provides surface for generation of XIIa)
CAUSES OF A LONG aPTT WITH A NORMAL PT/INR • Deficiency of VIII, IX, XI or contact factor (usually XII) • Heparin • Factor VIII inhibitor • Lupus-type inhibitor (antiphospholipid antibody)
Problems with the aPTT • Long aPTT may not indicate a bleeding tendency • Contact factor deficiency • Lupus anticoagulant • A normal (or short) aPTT is not necessarily an indication of an intact coagulation system • High factor VIII levels (eg, from endothelial injury) mask deficiencies of other factors • Circulating VIIIa can markedly shorten aPTT in DIC and other coagulopathies • Hemolysis shortens aPTT (lab rejects hemolyzed specimens)
# abnormal: 143 (14%) # TESTS # PATIENTS Abnormal result 143 97 On anticoagulant 64 37 Liver disease 41 27 No cause found, no bleeding 15 14 Normal on repeat testing 9 9 Known hemophilia 5 4 History of intestinal bypass 5 4 Other malabsorption (CF) 2 1 Technical problem with test 1 1 0 0 Newly dx'd bleeding disorder Robbins and Rose, Ann Intern Med 1979;90:796 The aPTT is not a good screening testResults of 1025 consecutive tests, excluding heparin monitoring
The Thrombin Time aPTT Thrombin time PT/INR • Add thrombin (human or bovine) to plasma, measure clotting time • Very sensitive to heparin and other thrombin inhibitors • If there is enough heparin in the plasma to prolong the aPTT the thrombin time should be very long • Also prolonged by low fibrinogen, dysfibrinogenemia, high levels of fibrin degradation products • Reptilase time (snake venom clots fibrinogen) not affected by heparin but sensitive to these other conditions
Mixing Study • Purpose: to determine whether long aPTT or PT is due to clotting factor deficiency or circulating inhibitor (eg, factor VIII inhibitor, heparin, lupus-type inhibitor) • Mix patient plasma 1:1 with normal plasma, measure aPTT or PT • Incubate mixture for one hour, repeat aPTT or PT • Certain inhibitors (eg, factor VIII antibody) take time to work • Failure to correct prolonged clotting time by mixing with normal plasma implies presence of a circulating inhibitor
Clotting factor assay • Serial dilutions of patient plasma in factor-deficient plasma • Serial dilutions of normal plasma in factor-deficient plasma (calibration curve) • Measure aPTTs of both sets • Semi-log plot - % of normal factor vs aPTT
3% <1%
100/.5 = 200% Patient C
100% Patient ≥50% 50% % test plasma 10% Normal plasma 5% 1% 20 40 60 80 aPTT (sec)
100% Patient 50% Factor VIII Inhibitor % test plasma 10% Normal plasma 5% 1% 20 40 60 80 aPTT (sec)
Bethesda Assay for Inhibitors • Serial dilutions of patient plasma in normal plasma • Incubate 2 hours • Assay residual factor activity • 1 Bethesda Unit neutralizes 50% of factor in an equivalent volume of normal plasma • Example: 1:100 dilution of patient plasma + normal plasma → 50% residual factor activity, so inhibitor titer is 100 BU
Bethesda Assay 50% Residual factor activity 100 BU 1:1 1:10 1:100 1:1000 dilution pt plasma
The decline and fall of the bleeding time • Advantage: an in vivo test that theoretically measures both vascular and platelet function • Disadvantages • Poor standardization • Accuracy depends on experience of operator • Poor sensitivity, very poor specificity • Does not predict bleeding risk
The bleeding time accurately detects aspirin use Rodgers and Levin, Semin Thromb Hemost 1990; 16:1
The bleeding time does not predict surgical bleeding Rodgers and Levin, Semin Thromb Hemost 1990; 16:1
Platelet function analysis • Whole blood passed through capillary tube coated with collagen plus either ADP or epinephrine (high shear) • Time to occlusion measured • Moderate sensitivity to platelet function defects, VWD PFA-100
Bleeding time vs PFA for detection of VWD C-ADP C-Epi BT Thromb Haemost 2003;90:483
Platelet function analysis • Advantages vs bleeding time • In vitro test • Well-standardized • Somewhat better sensitivity and specificity • Disadvantages • Does not assess vascular function • Does not predict bleeding risk • Abnormal test result → test for specific defects in primary hemostasis • Test not useful if platelets <100K or if patient taking ASA, etc PFA-100
Bleeding disorders that may be missed by screening tests • von Willebrand disease • Use specific assays • Factor XIII deficiency • Send out test for XIII activity • Some platelet function disorders • Aggregometry, EM, genetic testing • Fibrinolytic disorders • Vascular disorders
Platelet aggregometry • Various platelet agonists added to whole blood • Thrombin, ADP, collagen (2 concentrations), arachidonic acid, ristocetin (2 concentrations) • Aggregation decreases electrical conductance • Release measured by chemiluminesence • Significantly more sensitive than PFA • Many abnormal results nonspecific • Expensive
AA agg ADP agg AA rel ADP rel Collagen agg Low High Risto low agg Risto high agg High Low Collagen rel Saline agg Thrombin rel 2 nM ATP Ch 1 Ch 2
Pt Risto low Control Risto high Type I VWD
AA agg ADP agg AA rel ADP rel Collagen agg Low High High Low Collagen rel Pt Normal
AA agg ADP agg AA rel ADP rel Pt Normal Taking ASA 81 mg/d and Plavix 75 mg/d
Coll agg Low High Coll release Low High AA agg Coll agg AA rel Coll rel PFA: Coll/ADP 91 (nl 65-120) Coll/Epi 139 (nl 85-175)
Assessment of the fibrinolytic system • Fibrinogen • D-dimer • α2-antiplasmin activity • Thromboelastography
Global assessment of clotting: thromboelastography • Measures mechanical strength of clot vs time • Sensitive to most major defects in fibrin clot formation, platelet plug formation, excessive fibrinolysis • Can also detect hypercoagulability • Useful “point of care” test in OR, etc
30 min Clotting parameters in thromboelastography • R value: time from adding activator until clot formation starts (analogous to aPTT, sensitive to clotting factor deficiency, heparin) • Angle: Rate of initial clot formation (sensitive to fibrinogen concentration and platelet number/function) • MA: maximal amplitude of clot strength (mainly determined by platelet number/function) • LY30: degree of clot lysis at 30 min
Effect of Coagulation Factor Deficiency on TEG Normal Factordeficiency
Effect of platelet abnormality on TEG Thrombocytopeniaordysfunctional platelets Normal
Effect of hyperfibrinolysis on TEG Normal Hyperfibrinolysis
Effect of hypercoagulability on TEG Normal Hypercoagulable
Black line = standard TEG (fibrin + thrombin-activated platelets Green line = fibrin only (venom protease generates fibrin) Purple line = venom-generated fibrin + AA or ADP-activated platelets Arrows = contribution of platelets to clot strength under test conditions A B Platelet mapping If B < A platelet response to ADP or AA is inhibited