Download

1 / 33
330 likes | 461 Vues
Research on exchange flows in a long shallow channel connecting Lake Ontario and Little Sodus Bay, investigating the effects of barotropic and baroclinic forcing, turbulent diffusion, unsteadiness, and wind stress. The study highlights the importance of vertical diffusion, bed friction, and temporal unsteadiness in understanding the flow dynamics. Utilizing a computational model to simulate various scenarios, the project aims to unravel the complexities of the exchange flows within the aquatic system.

E N D
Exchange Flows Through a Long Shallow Channel Edwin A. Cowen DeFrees Hydraulics Laboratory, School of Civil & Environmental Engineering, Cornell University, Ithaca, NY USA Francisco J. Rueda Grupo de Rios y Embalses Universidad de Granada, Granada, Spain DBE-0083625, CTS-0093794
Fundamental Hypothesis of the ProjectBiocomplexity: Physical, Biological, and Human Interactions Shaping the Ecosystems of Freshwater Bays (DBE-0083625) The average time water takes to move through an aquatic system is a key variable defining the extent that ecosystems are self-organized or dominated by outside influences.
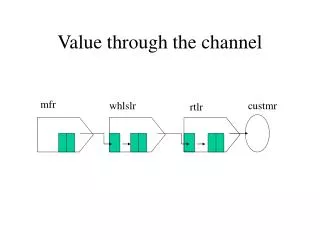
x,t1 Exchange dominates t2 t1 t0 Residence time Age = F(n,t0) Transit time tR=V/Q? A Better RTD1 Embayment 1 Lake Watershed 2 1Rueda, R.J.; Cowen, E.A. (2003). Circulation and Exchange in a Freshwater Embayment: Residence Time Scales. Submitted to Limnology and Oceanography.
**** LITTLE SODUS BAY **** • Area - 2.96 km2 • Deepest point – 12 m • Volume (V) – 20020311 m3 • Mean daily discharge (Q) - 0.15 m3/s • V / Q ~ 1544 days (?) Lake Ontario Ithaca
Experimental Setups for Series of Deployments 2001-2002 • 5 strings with SBE-39 pressure & temperature Loggers (S1 – S5) • Meteorological station • RDI-1200Khz-ADCP at Channel • Nortek & Sontek – ADVs in Channel • SCAMP casts in Channel x - channel
4th Mode Barotropic Seiche is Dominant Forcing at Sub-Diurnal Time Scales x - channel
3 m deep The Long Shallow Channel Connecting Lake Ontario to Little Sodus Bay View South View North Lake Ontario Little Sodus Bay 50 m 500 m Lake Ontario
The Canonical Inviscid Picture of Exchange Flows (e.g., Armi & Farmer 1986) Lake Ontario Little Sodus Bay Baroptropically dominated residual circulation Baroclinically dominated two-layer exchange flows
Along Channel Velocity Profile Time Series (1200 kHz ADCP) Reveal Barotropic `Tide´
T=3.0 s October 11, 2002: A Wave Driven Turbulent Boundary Layer with large-Scales Constrained to 2-D Turbulence T=93 min Dispersion Relation: l=13 m kh = 1.6 T=12 min (H2/Kv)0.5 =15 min -3 Kv 10-4 m/s2 -5/3
Is the Inviscid Internal Hydraulic Model Valid in a Long Shallow Channel? Ivey (2002) suggests that if Diffusive Hydraulic The flow is transitional between diffusive dominance (diffusion-buoyancy balance) and internal hydraulic dominance (buoyancy-inertia balance). Note H5 and L-2 dependencies! Shallow long flows tend NOT to be inviscid!
Estimating the Vertical Diffusivity (Kv) • Deploy 3 ADVs on a bottom mounted frame. • Measurement Volumes at 0.3, 1.5, 2.5 m above bed. • Apply Shaw & Trowbridge (2001) linear filtration and differencing technique to remove waves and pass turbulence.
Vertical Diffusivity and Modified Gravity Temporal Histories for Oct. 11, 2002
October 11, 2002 Observations Suggest Inviscid Approximation was Extremely Poor!
Importance of Bed Friction • The ratio of friction to inertia is • Cleary bottom friction is often as or more important than inertia!
Importance of Temporal Unsteadiness • Heilfrich (1995) suggests that if the time for long internal waves to propagate through a channel, , is the order of the time scale of the barotropic flow, 1 – 2 hours as seen in our measurements, then temporal unsteadiness can not be ignored. • October 2002 data 3 < tw < 8. • These are weaker than typical, 2ºC across channel leads to tw 1 hour, under stronger temperature gradients, tw < 1 hour. Temporally unsteady effects cannot be ignored in Little Sodus
More on the Importance of Unsteadiness • Ivey (2002) Defines a fluxed based unsteadiness parameter Whereais the amplitude of barotropic oscillations, B is the width of the channel, Bb is the width of the basin, and T is the barotropic period. Ivey suggests that for 0.5 < ET < 5 both baroclinic and unsteady forcing is important For October 2002 observations, 0.2 < ET < 1 only for very strong baroclinic events (upwelling) is ET > 5
We Have Shown • Vertical diffusion is often important • Bed friction is often important • Unsteadiness is often important • Flow is predominantly 2-D with the vertical and along-channel coordinates active. To investigate the details of this flow we turn to a numerical model
The Computational Model • Princeton Ocean Model (POM – e.g., Blumberg & Mellor, 1987). • 3-D, hydrostatic, Boussinesq, sigma coordinates. • Dx = Dy =25m, 24 layers in vertical (Dz =0.1m in channel). • a =2cm, T=2hr, DTc ,LSB temperature set at 25ºC. • Effect of wind stress also investigated. N
LS LO Channel Channel Barotropic F02>>1 F02<~1 Baroclinic
Conclusions • Long shallow channel flows are highly complex and the result of a subtle balance between: • Barotropic forcing • Baroclinic forcing • Turbulent diffusion • Unsteadiness • Wind stress • Extreme care should be taken when interpreting thermistor string/temperature profile data as the presence of different temperature regimes is not sufficient to conclude active layer flow.
Evidence of Strong Mean Boundary Layer (1 minute averaged data)
Rapidly Varying Strong Shear Exists Animation