Download
1 / 18
180 likes | 735 Vues
Michael Giordano President, FIS. Credit Spreads, Interest Rates, Inflation, and the Current Bond Market. Gaining Market Perspective. Goal: become comfortable with estimates of risk premiums for the major asset classes (specifically credit) Compare performance of all major asset classes

E N D
Michael Giordano President, FIS Credit Spreads, Interest Rates, Inflation, and the Current Bond Market
Gaining Market Perspective • Goal: become comfortable with estimates of risk premiums for the major asset classes (specifically credit) • Compare performance of all major asset classes • Past 10 years: • Global market index (major asset classes): +4% • Equity markets: Flat • US Investment grade bonds: +6.3%
Introduction – Credit Spreads • Spreads between interest rates on various private and public sector debt contain valuable information • Spreads widen during recession and contract during economic expansion • Contracting spreads is a positive sign for markets/economy • Looking for default risk changes and liquidity changes in the market • Different ways to compare short-term vs. long-term interest rate/inflation expectations • Ex. 2yr-10yr spread
What’s Going On? • Driver of current economy and policy response was the bust in the housing market and as a result the busts in the mortgage, credit and stock markets. These busts subtracted tens of trillions of dollars of wealth and credit from the global financial system (deflationary) • Policy response = inflationary (injecting money into economy) • $8000 first-time homebuyer credit • Cash for clunkers • Low Fed Funds rate • Investors reduced demand for high-yield securities as default rates spiked and sought safer investments. While exiting the market, spreads widened, became illiquid. Monetary policy (extended period of low interest rates and recovery) increased liquidity to the high-yield sector, and spreads have narrowed
Recent Policy Impact • Boom in stock, credit, and mortgage market over past 6 months (+60% bear market rally in W-shaped recovery) • Increase in M+A activity (WSJ) • Stabilization of housing prices • Average American, with less wealth and feeling less wealthy, is still cutting back on spending (measured by consumer spending). Decrease in demand lowers prices, mild deflation
Recent FED Announcement • Economy IS accelerating (S&P500 up 1.3% yesterday) • Corporate bond spreads have collapsed • May hold off increasing rates (Fed Funds rate currently targeting 0-0.25%) until after the mid-term congressional elections in 2010 • Policy maker consensus: Long-run inflation of about 2% (5-year trailing average inflation = 3.2%) • Economy will slow once rates increase, resulting in W-shaped recovery (also pressures weaker dollar) • Weaker dollar = increase in commodity prices = inflationary pressure
Inflation vs. Deflation • Inflationists: • Fed policy and money supply. More money in circulation leads to inflation • Fed Funds rate around 0.0% • Countless debt repurchase programs (Fannie Mae, Freddie Mac) • Purchasing hundreds of billions of dollars of commercial paper • Massive increase in money supply = inflation • Deflationists: • Massive deleveraging in housing, mortgage, credit and stock markets • Fall in prices of these assets destroyed trillions of dollars of wealth and credit
Future Implications • Eventual rise in interest rates will squeeze consumers and business (higher servicing costs) and leave less money for consumer spending. Higher cost of debt will constrain borrowing. W-shaped recovery. • Massive government spending and debt accumulation, drop in dollar and rise in imports will be inflationary. It will increase the prices of foreign goods (consumer price inflation). • Inflationary and deflationary forces both at work
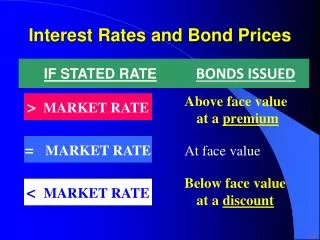
Bonds and Yield • Owning a bond = owning a stream of future cash payments (periodic interest or coupon payments, and ultimate refund of principal) • A bond’s Yield to Maturity (YTM): the discount rate that is used to make the PV of a bond’s cash flow = its price. • The price of a bond is the sum of the present value of each cash flow, calculated using the same discount factor. The discount factor is the yield. • When yields rise, price falls. When yields fall, price rises. • Maturity largely affects yield: • Yield curve: represents the YTM of a class of bonds over different maturities • The longer the term, the higher the yield, because the longer the period of time before each CF, the more chance the required discount rate (yield) will move higher
Bonds and Yield • Bond value usually quoted in terms of yield • Yield: annualized holding period return if investor held the bond to maturity • Bond yields embody a reward to investors for forgoing consumption today (along with other considerations) • Corporate yields are almost always higher than Treasury yields of comparable maturities because of the default risk (along with other factors)
Credit Risk • Risk that the issuer will not make scheduled payments. The higher the risk of negative credit event (default, etc), the higher the interest rate investors will demand for assuming that risk. • Private rating agencies (Moody’s and Standard & Poor’s) provide guidance for investors to the credit quality of various issues. • Credit spread = difference between the yields on a “defaultable” corporate bonds and a US government bond of comparable maturity. • US Treasury bonds are considered to have zero default risk. (No chance US Gov’t will default, thanks to constant tax revenue)
Credit Ratings • S&P • Investment Grade: AAA, AA, A, BBB • Speculative: BB, B, CCC, CC • Moody’s • Investment Grade: • Aaa • Aa1, Aa2, Aa3 • A1, A2, A3 • Baa1, Baa2, Baa3 • Speculative (high yield, junk): • Ba1, Ba2, Ba3 • B1, B2, B3 • Caa1, Caa2, Caa3 • Ca • C
Credit Spreads • TED Spread • Difference in rates between inter-bank loans and short-term government debt (T-Bills). (usually 3-month rates for each) • Measures lending market’s overall perceived credit risk, the difference between risk free rates and still relatively-low-risk inter-bank lending rates. • Bank’s willingness to lend to each other
Credit Spreads • LIBOR-OIS Spread • Difference between LIBOR (London Interbank Offered Rate) and the Overnight Index Swap rate (interest rate charged for short-term interbank loans) • Perceived availability of funds available for short term loans • Lower the spread, more liquid the market
Credit Spreads • Commercial Paper – Treasury Spreads • Clearer gauge of liquidity premium • No prepayment risk for commercial paper • High grade corporate – Treasury Spreads • Indicates prepayment premium: investors demand a prepayment risk premium for the possibility that issuers/borrowers will refinance debt if interest rates fall. Look at high-grade callable bonds vs. treasuries of same maturity • Little default risk difference between two types. Primary distinction = when interest rates fall, private sector bonds can be called and refinanced, and treasuries cannot. So, this spread contains prepayment (embedded option) risk premium that reflects interest rate risk. • Liquidity premium associated with more stable (liquid) demand for Treasuries.
Interest Rates and Inflation • Interest rate risk = bond’s price will change due to changes in interest rates (both long-term and short-term) • “bond’s worst enemy” – inflation, erodes the purchasing power of a bond’s future cash flows. • Higher expected future inflation = higher yields across yield curve (demanded by investors for inflation risk) • Expected inflation is a function of changes in short and long term interest rates (short term = Fed Funds Rate, LIBOR)
Inflation • Market forces of supply and demand and equilibrium pricing of long-term bonds set long-term interest rates • If investors believe FOMC set rate too low, inflation expectations increase, and long-term interest rates increase relative to short-term (curve steepens) • Higher future inflation = higher interest rates and bond yields, lower prices, to compensate for the loss of FCF purchasing power • Bonds with longest terms will see greatest increase in yields and price decrease • Level of exposure to interest rates (measure of price change relative to interest rate changes) measured with Duration. • Recognize where bond falls on yield curve to determine whether or not it will be affected by short or long term rates.
Measuring Inflation Expectations • Measure with spread between Treasury securities and TIPS • TIPS-Treasury Spread • As of 9/28: • 10 year treasury note: 3.43 • 10 year TIPS: 1.64 • Spread = 3.42-1.64 = 1.78