Download
1 / 1
10 likes | 80 Vues
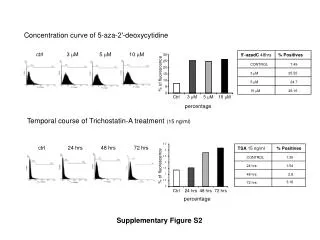
Monitoring the concentration curve of 5-aza-2′-deoxycytidine and Trichostatin-A treatment over time, showing the percentage of fluorescence at different doses.

E N D
Concentration curve of 5-aza-2′-deoxycytidine ctrl 3 M 5 M 10 M 5’-azadC 48hrs % Positives 30 25 CONTROL 7.49 20 3 mM 25.55 % of fluorescence 15 5 mM 24.7 10 5 15 mM 26.16 0 Ctrl 3 mM 5 mM 15 mM percentage Temporal course of Trichostatin-A treatment (15 ng/ml) 3.5 ctrl 24 hrs 48 hrs 72 hrs TSA 15 ng/ml % Positives 3 CONTROL 1.36 2.5 2 24 hrs 1.54 % of fluorescence 1.5 48 hrs 2.8 1 72 hrs 3.18 0.5 0 Ctrl 24 hrs 48 hrs 72 hrs percentage Supplementary Figure S2